Digital advertising is a complicated beast. Let’s think about the scenarios that cause so many headaches for digital advertisers and answer the following with what you would do: Kill, Segment, Leave, or Scale
- You’re not seeing the growth and success you were hoping for from the new campaigns.
- You spot a campaign that works, but you don’t know why it’s working?
- A new ad doesn’t seem to work at all.
- Your campaign worked well, but now it’s slowly getting worse.
- Your remarketing campaign works well. Now you don’t know if you should increase the budget to get more sales or spend more at the top of the funnel to grow your remarketing audience?
Campaign Optimization
As an optimization specialist, I would say it’s challenging to make a call on any of these questions without first knowing if the campaigns are helping achieve the overall goal, or having a robust decision-making process in place.
This blog post will detail:
- How to find the acquisition loops that will scale your campaigns.
- How to model your campaigns, their growth, and potential.
Customer Success Story
Let me introduce you to Ronnie Teja.

His most recent venture, Savonit, is a Microsoft Gold Certified partner and software reseller. They build their core marketing strategy around search engine marketing, social, and email.
By implementing a robust decision-making process, we could rapidly scale the store whilst improving the performance of the advertising campaigns in a controlled manner using data.
But it wasn’t always like this!
When Ronnie’s team had launched the new website, they wanted sales fast. The ad campaigns were live, but they weren’t getting the conversion rates or even the sales they were expecting.
The ads looked great, the sales funnel was seamless, and he had terrific offers. All he needed was a steady stream of customers, and he thought he would have the revenue pour in to match.
However, that didn’t happen, so he looked into his campaigns to see where there was a blockage.
Now that Ronnie had some data to work with, it was time for us to jump into the numbers, and like surgeons, extract the tumours that would cause Ronnie’s business to collapse.
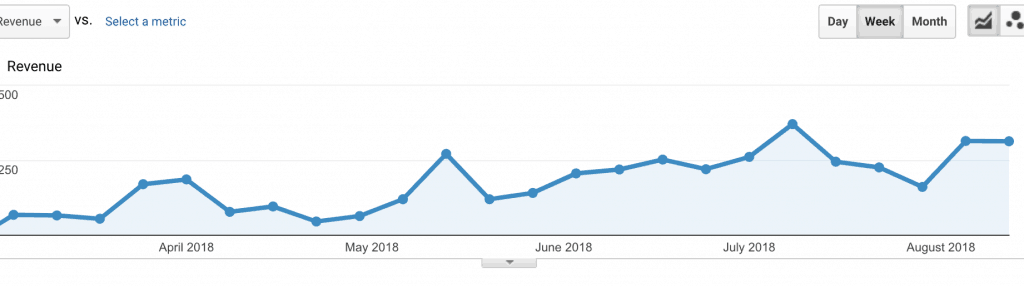
Taking Ronnie from these figures to a $1.3 million revenue per year resulted from meticulously tinkering with the ad sets, continually boosting what works, and killing what doesn’t. If you want to achieve a higher return on your marketing investment, lower your advertising costs, and increase the number of conversions, you, like Ronnie, will need a step-by-step ad optimization strategy.
I will share with you my proven method that helped Ronnie turn his advertising investments into profitable sales.
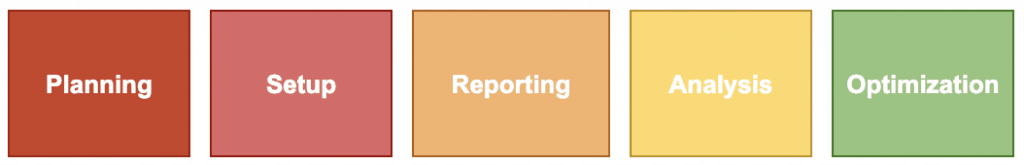
Optimization Is A Process
The challenge many advertisers have is that they don’t have a process for optimizing their ad campaigns so they spend more money than they make or they do not identify the biggest opportunities and leave money on the table.
If you were to assess your own ad optimization process which of these would you be guilty of?
- You cannot assess your performance in real time.
- Your most important data is siloed in by different teams.
- You throw down some new ads just to see if they work.
- You don’t have an accurate system for analysis.
- There aren’t clear goals and objectives for the marketing team.
- Your test results can be confusing.
- You follow short-term thinking with no long-term objectives.
- You look at small details rather than the big picture.
- You introduce new variables into a campaign without having any controls.
If any of these are true for you then you’ve probably found taking action and optimizing your campaigns is more difficult than it should be.
They key to successful optimization is having a process.
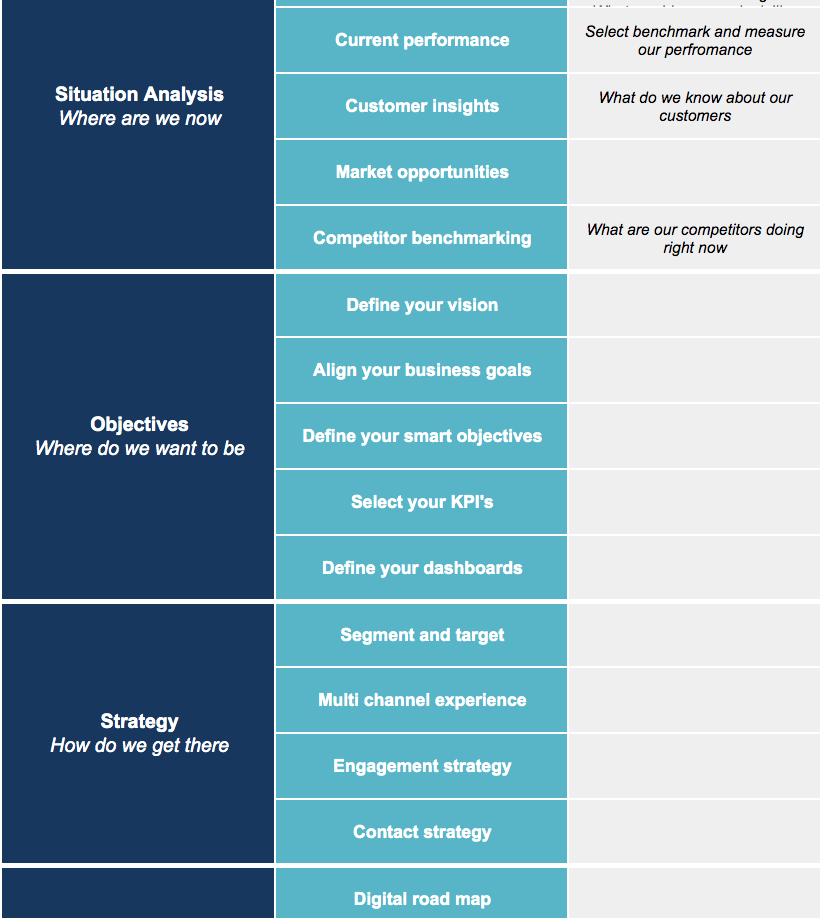
Define your marketing strategy and objectives
Your strategy will change with time, but having your objectives clearly detailed from the start will make your optimization process more calculated and controlled–you shouldn’t be shooting from the hip.
Despite everyone’s marketing strategy being unique to them, I want to prefix the next few chapters with some general thoughts.
- Keep your marketing strategy simple
- Don’t be afraid to try new features
- Find a middle ground between researching and taking action
In the modern landscape, your marketing strategy must remain flexible. You have to adapt to the new tools, features, competitors, media, and customers. Therefore, I don’t believe in over-complicating your marketing strategy. Most times, the simpler it is, the better.
Click to download the Planning Worksheet
Simple strategies are easier to manage, optimize and scale, but some of the best opportunities are found in the new features that the platforms roll out and you shouldn’t be afraid to try them.
This presents a chicken and egg situation. We can easily get wrapped up in the data and not take action. Alternatively, we can get so excited about all the new tools, formats and ideas we never really make an informed decision and jump to a new test before ever really learning if something worked.
So, to achieve maximum impact, you need one clear and measurable goal. You cannot achieve multiple outcomes, unless you have bottomless pockets.
To choose that goal, you want to know what is the one thing that will help your business, and that usually means finding the thing that will have the most significant impact, right now. Ask yourself, what would that be and what it would not be for your business? The objectives you set yourself will have a huge impact on the campaign and the channels you use.
Here are a few measurable goals that a data-driven optimization strategy can achieve:
- More customers at a certain price
- Increased profit
- Lower cost per customer
- More signups
If I go back to Ronnie, getting cheap clicks was easy, but Ronnie’s business wasn’t built on cheap traffic. He was always very clear about what he wanted – he wanted to scale Saveonit as quickly as possible.
He was happy to forgo increased profits and instead spend his money on marketing to gain market share. To be clear about what that meant: Ronnie wanted rapid growth of the website traffic and with it, increased sales.
To work towards this, we mapped out each step of the sales funnel and our targets.
Tie your metrics to your objectives
Your measurable goal will depend on the marketing strategy you defined at the start.
Here are some examples of measurable goals for ad optimization:
- Advertising cost of sale (ACoS) = Costs ÷ Gross revenue from Ad campaign x 100
- Conversion rate = Conversions ÷ Clicks
- Cost per sale or lead = Costs ÷ Sales or leads
- Reach/cost
However, in most cases this is easier said than done.
Let me explain…
For Ronnie it was all about Return On Ad Spend (ROAS).
If you didn’t know, ROAS is the ratio of total website conversion value divided by your ad spend. If your ads have a ROAS of 100 that means that for every dollar you invest in advertising, you get 100 dollars in return.
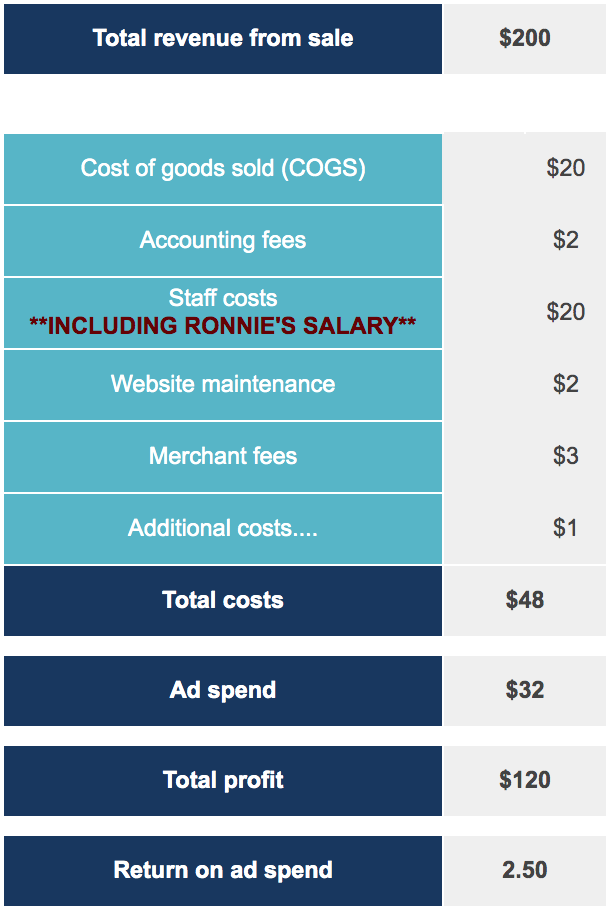
For Saveonit to be profitable, Ronnie needed a return on ad spend of at least 2.5. For every $1 he spent on ads, Ronnie wanted $2.50 back. Ronnie already knew his target ROAS because he had worked out at what point his sales were breaking-even.
Let’s say Ronnie sold a product and made $200 in total revenue.
The cost to Ronnie for the goods sold was $50, but he also has expenses like accounting fees, staff costs, website maintenance, and merchant fees that come to $60. This gives Ronnie a profit after sale of $90, meaning every time he sells a $200 product, he makes $90.
200 – 60 – 50 = 90
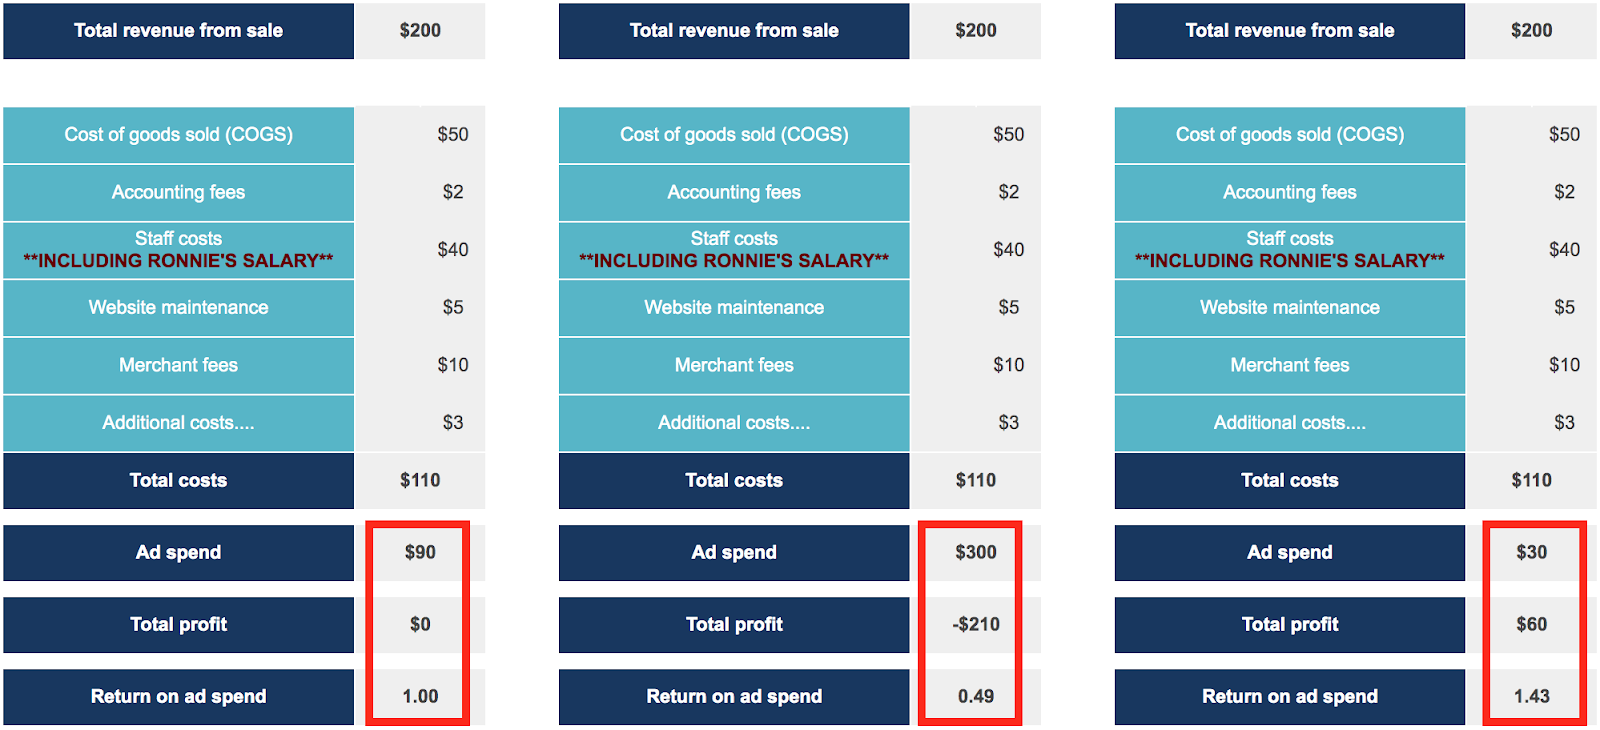
Because his break-even ad spend is $90, if he spends $100 to get a single $200 sale, he’s losing $10. If he spends $30 to get a $200 sale, he will make $60 in profit.
And when you translate spending $30 on ads to make $200, that turns into a minimum ROAS of 1.43.
ROAS = Gross revenue from Ad campaign ÷ Costs
So if Ronnie wanted a return of 2.5, perhaps his cost breakdown would like this:
What’s more…
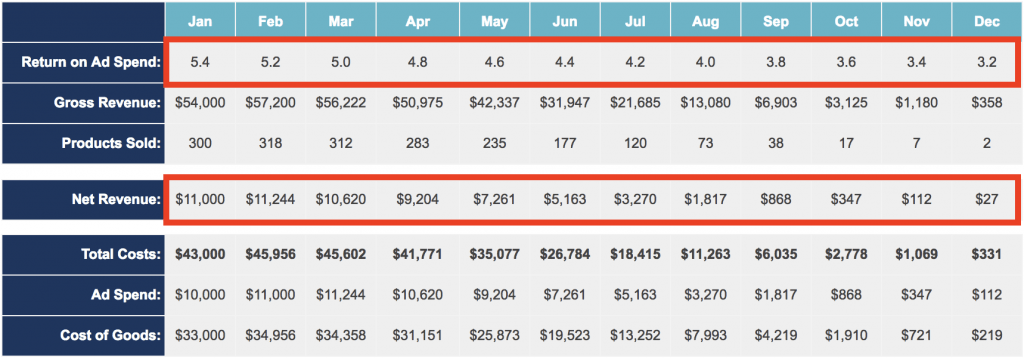
Remember, while your campaigns may have a positive ROAS if it’s not accurately estimated and if it’s too low then you could stifle the growth of your marketing campaigns.
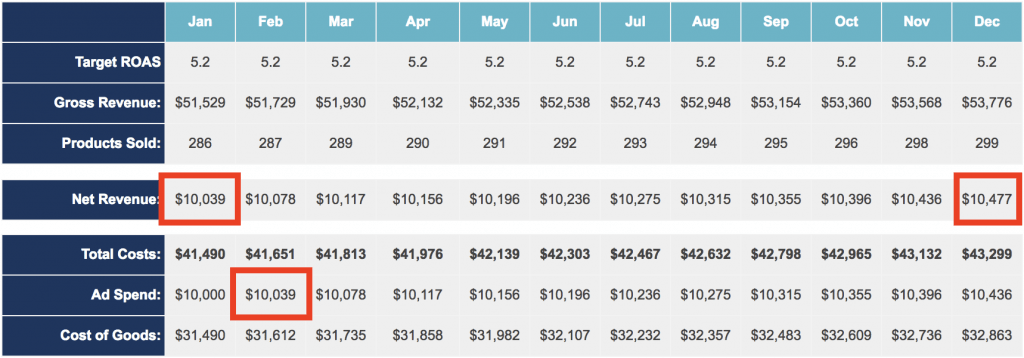
You must work out your target ROAS based on your margins, but also include the cost of following month’s advertising in the ROAS calculation. With the addition of following-month’s advertising spend we could generate more capital to spend on advertising space the following month.
Click to download the ROAS Worksheet and see if you’re at risk of losing money
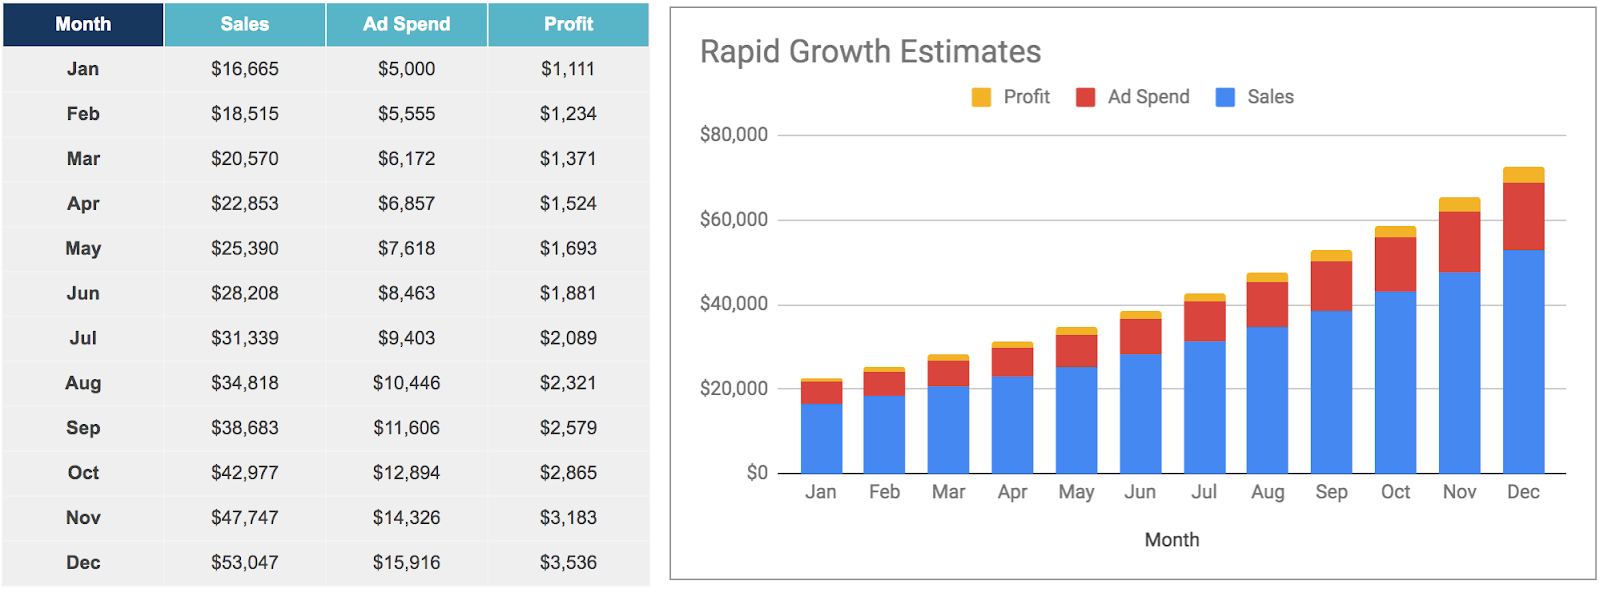
You can see in the chart below that if the ROAS drops, it ends up in a downward spiral and the net revenue drops too.
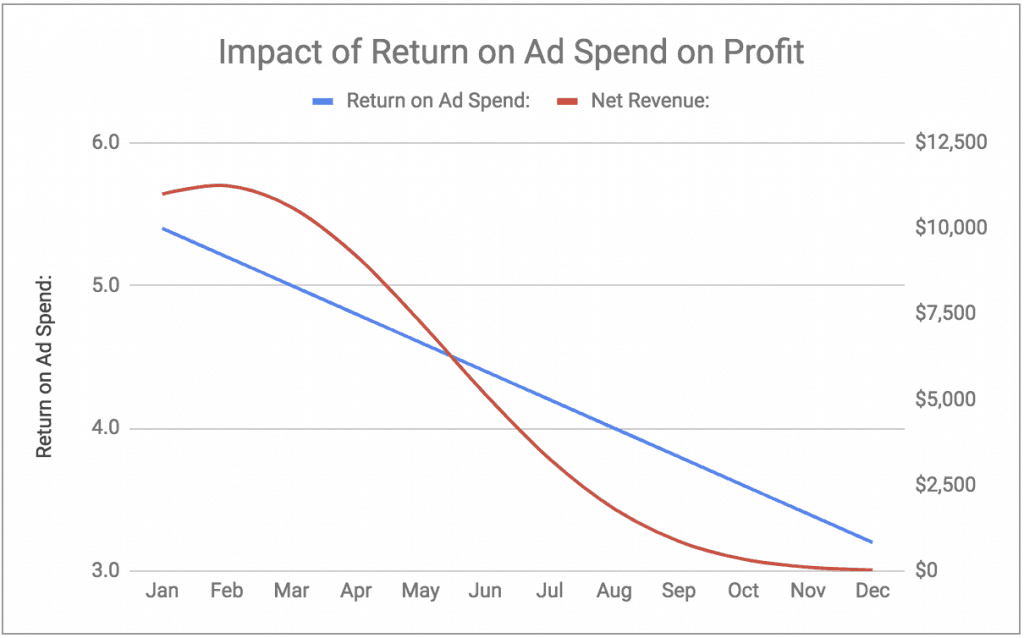
You can use the ROAS Calculator tool to work out if your current ROAS will run your marketing campaigns in to the ground.
However, Ronnie found using ROAS or ACoS was an effective goal/control because his success was tied directly to the sales numbers and he could scale his campaigns very quickly.
As well as our weekly and monthly goals we had also broken down our one- to four-year goals. That enabled us to work out what targets we need to hit for each of our benchmarks to achieve our goals.
You can use this tool to work out your target ROAS yearly.
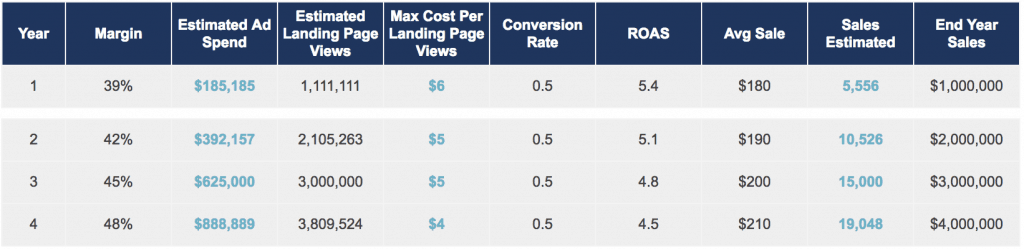
So, we tied Ronnie’s web metrics to his business objectives that way we could measure the overall performance.
As you can see, there’s a lot that goes into this step of the process. If you need help tying your measurable goal to your objectives reach out to mike@known-digital.com
Set your benchmarks
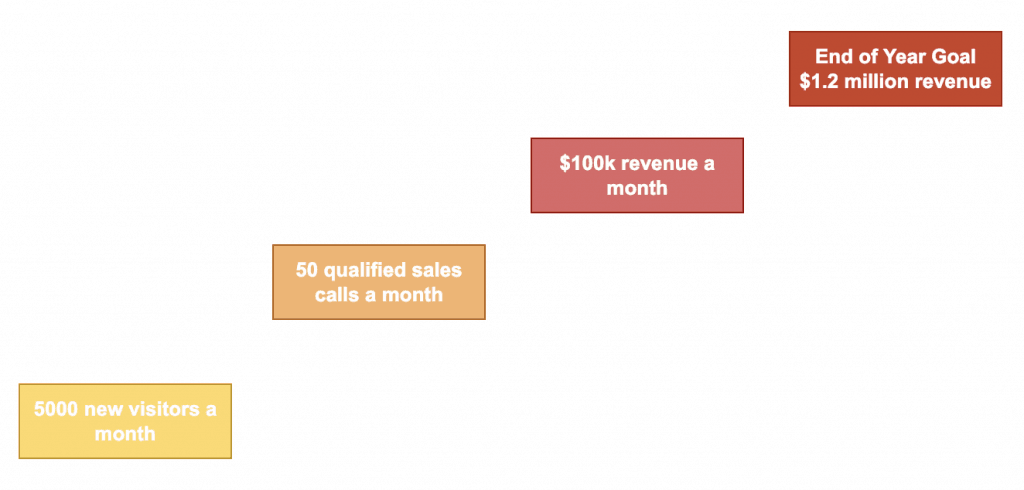
Now work backwards to see what targets you need to hit to reach your goal, so tyou can give yourself benchmarks along the way.
Working backwards looks something like this:
- To achieve $1.2 million in revenue we will need 113 sales.
- To achieve 113 sales we would need 566 calls.
- To get 566 calls we need 629 booked calls, and so on and so on.
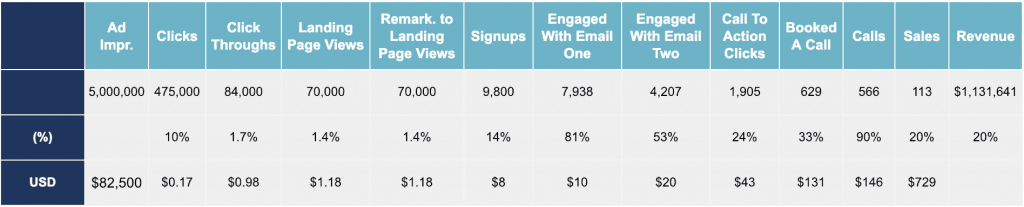
Click to download the Funnel Resources Data Worksheet
Using the Funnel Resources Data Worksheet it’s now possible to derive some cost/benefit benchmarks.
And there you have it. Rather than being overwhelmed by seemingly unattainable goals, you can now break them down into manageable chunks with guides to let you know how you are doing along the way.
Visualizing Your Optimization Trends
Set up your tracking
Make sure you have tracking set up and make sure it works. You need your conversion tracking in place for the advertising platforms you’re using, and you’ll want web analytics in place.
Visualize your performance trends
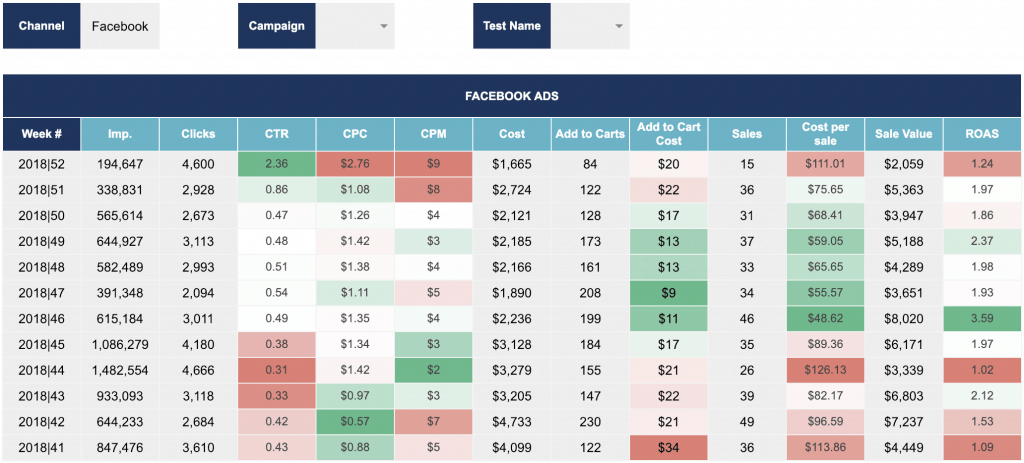
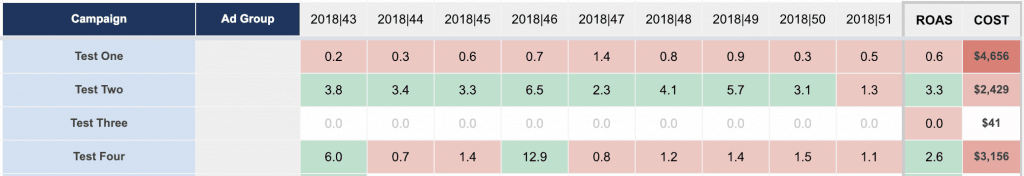
To visualize your performance trends, you need to measure your performance against your benchmark metrics, in Ronnie’s instance, ROAS by volume or spend.
The volume and spend were important because we wanted to focus our efforts in the areas that will have the biggest impact. If you have an ad that doesn’t perform, but only spends $5, it isn’t a problem. If you have an ad that just breaks even, but swallows 50% of your marketing budget, that’s 50% of your budget you could have spent on something that works.
By measuring over time and against volume you’re able to see the fluctuations in performance.
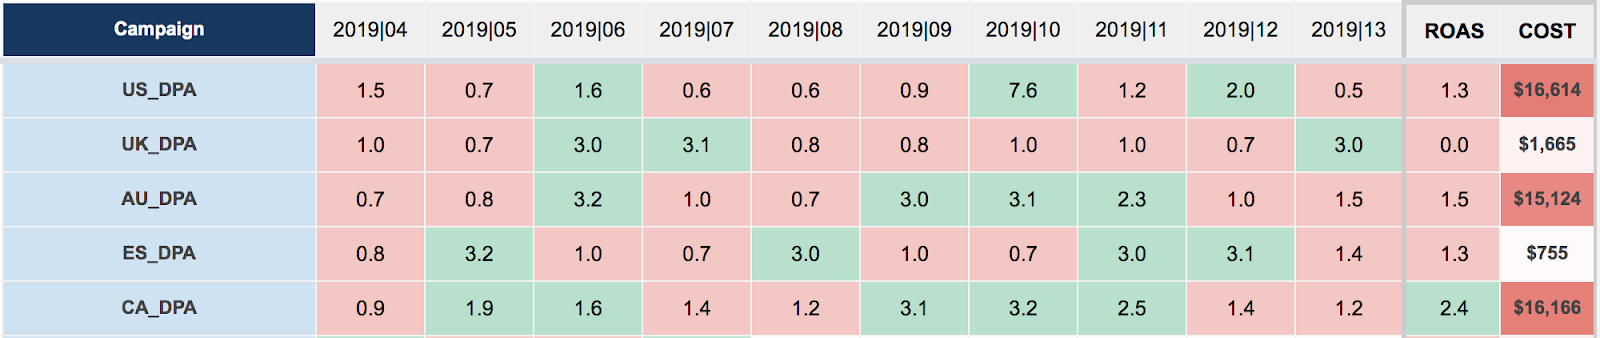
Click to download Performance Trends Worksheet
How often should you optimize?
The cadence to your optimization process depends on:
- The amount of ads your campaigns deliver
- The cycles of your business
- The last time you made a change to a campaign
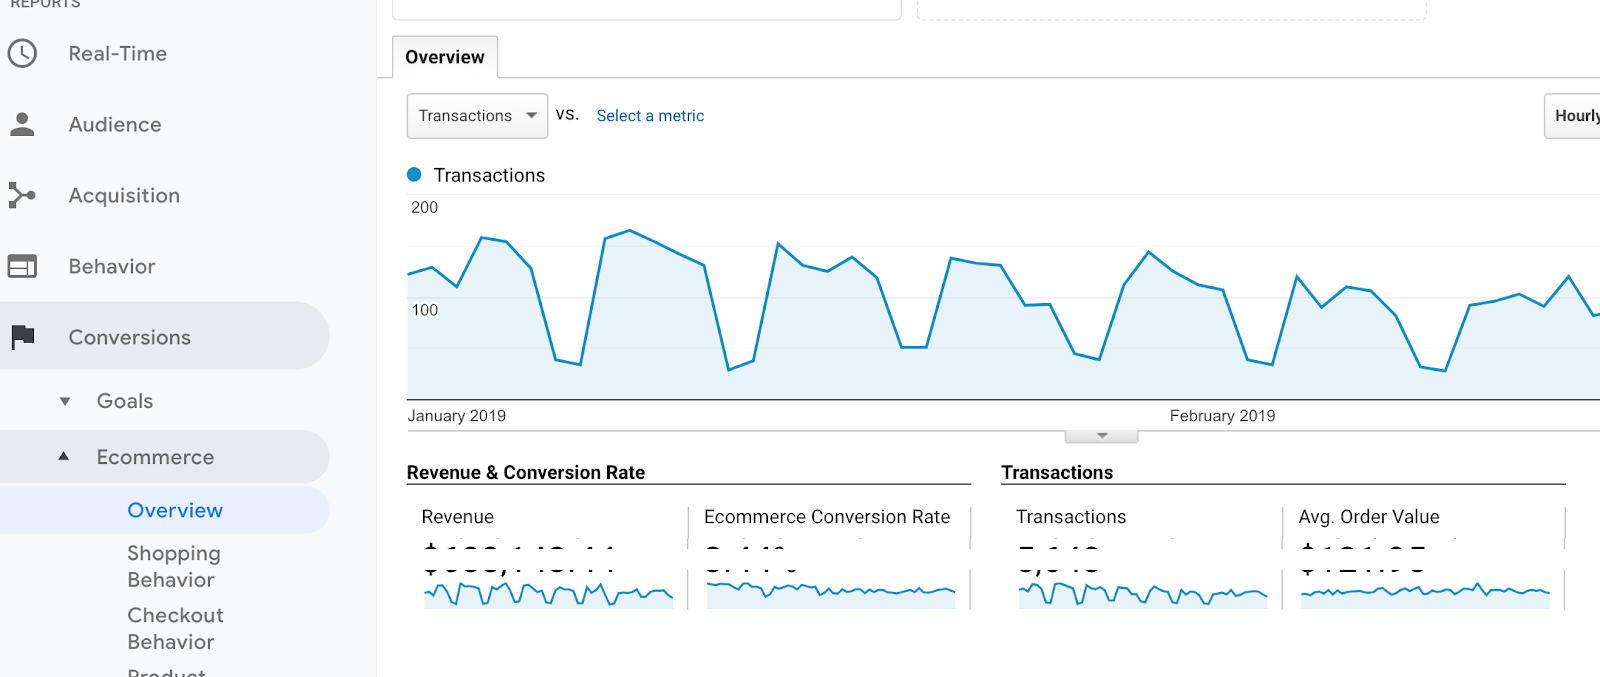
Google Analytics can help you understand your business cycles. Basically, if the bulk of your sales happen at a certain point in the week or month, you need to let a series of those cycles pass before you can make additional changes.
If you take action before you have enough data to make an accurate prediction on the outcome, you are shooting in the dark.
Let me explain…
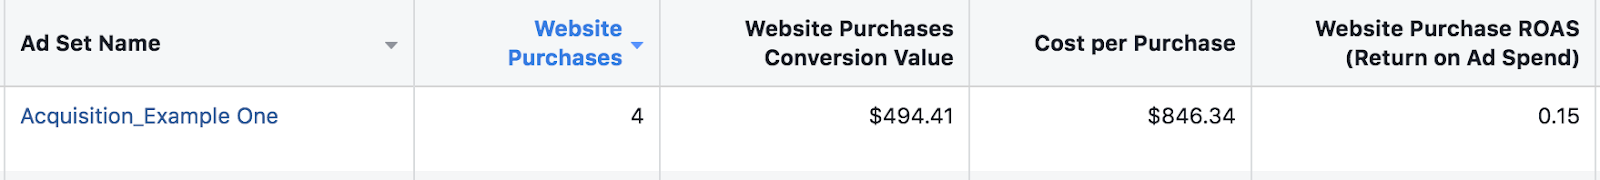
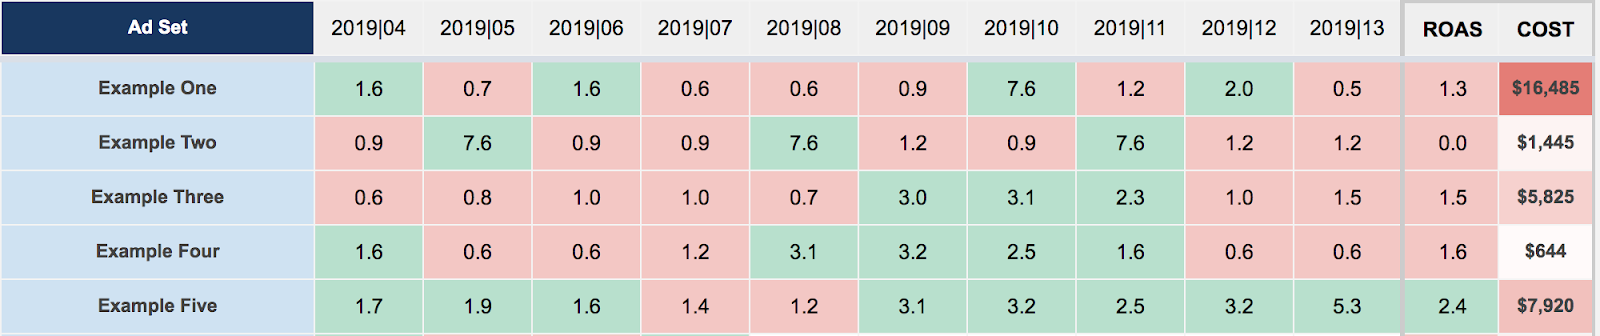
The average sale value of a software package on Saveonit was $199.99 and our target cost per sale was $100. We set up several Ad Sets targeting people interested in software and tried to identify which interest groups had the highest value customers in.
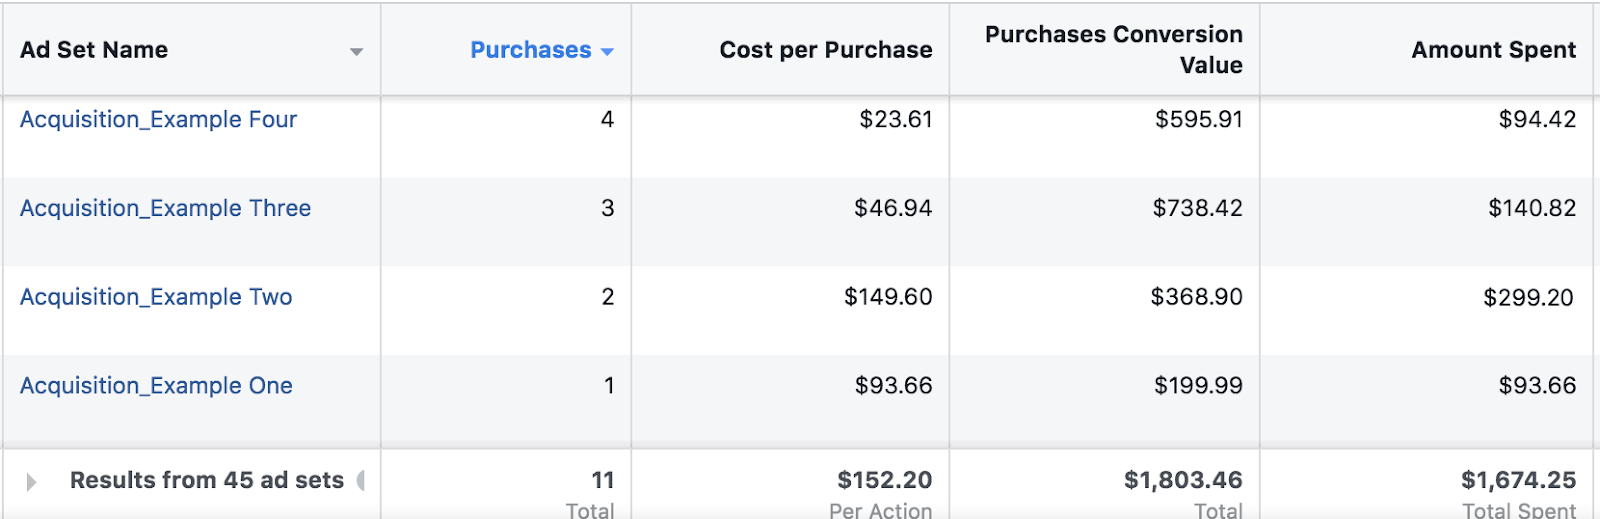
If you look at Acquisiton_Example One you can see we had only spent $93.66 on ads. We hadn’t spent enough money to determine if the ad was working. In fact, we hadn’t even spent enough money to get one sale yet.
At this point we could not estimate the effectiveness Ad Set because we did not have enough data.
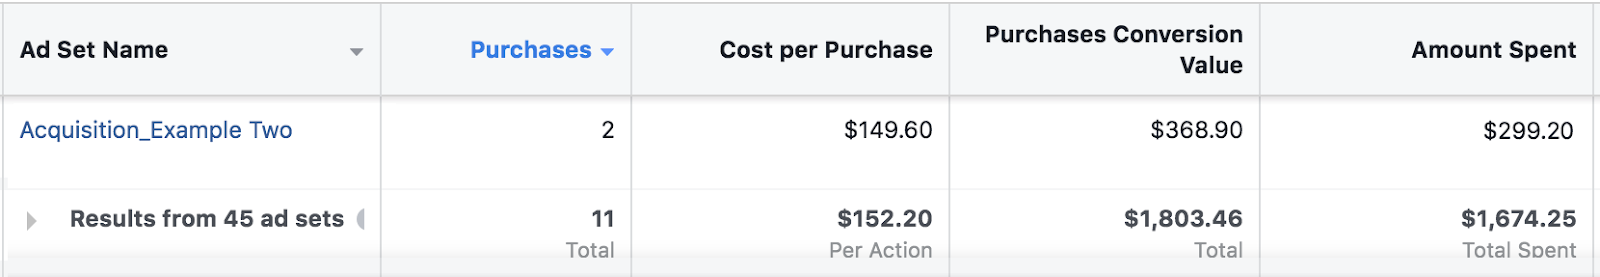
Yet, If you look at Acquisiton_Example Two the Ad Set had spent $299.20 and driven only two sales. It’s fair to say that at a cost per sale of $149.60 we’re losing money but we still hadn’t spent enough to prove it wasn’t working.
If a user converts within our attribution window, our cost could drop from $149.60, to $100. Now we’d be making money again.
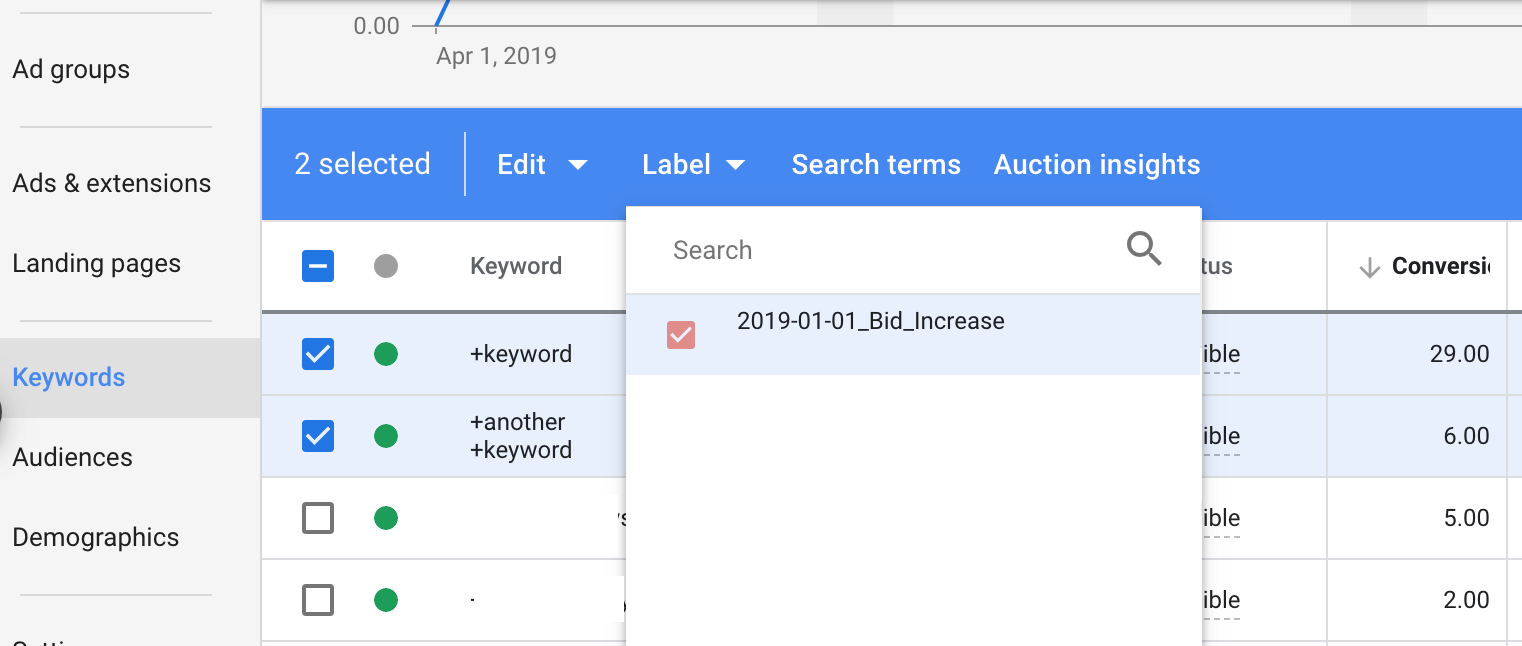
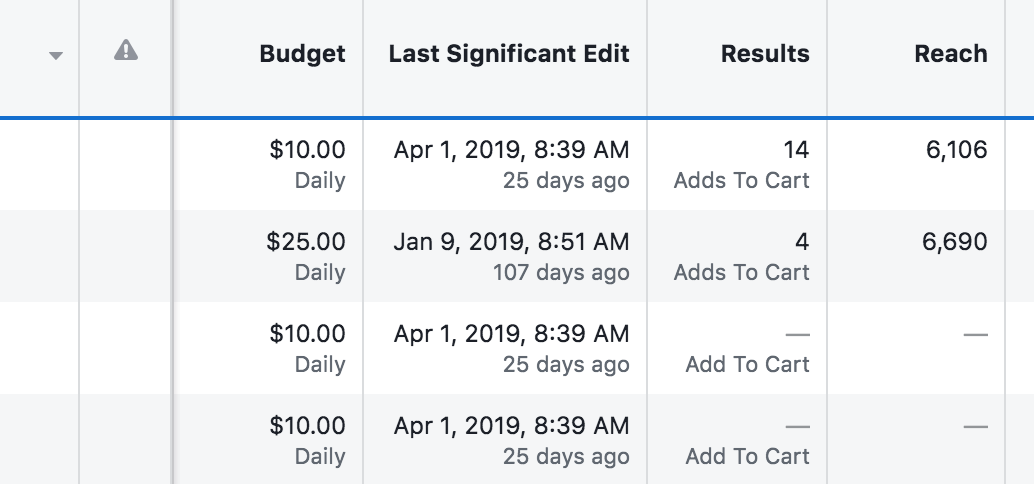
If you make significant optimizations to an account today, you must create a record of the edits because you won’t be able to make changes again until you have served enough of the ad (with the changes) to make accurate predictions. In most platforms there are ways for you to create a record of your edits.
Before you can confidently make changes two very important conditions must be met:
- The number of ads served must be big enough that the results are reliable.
- The test has run for long enough so that the sample is representative of your audience.
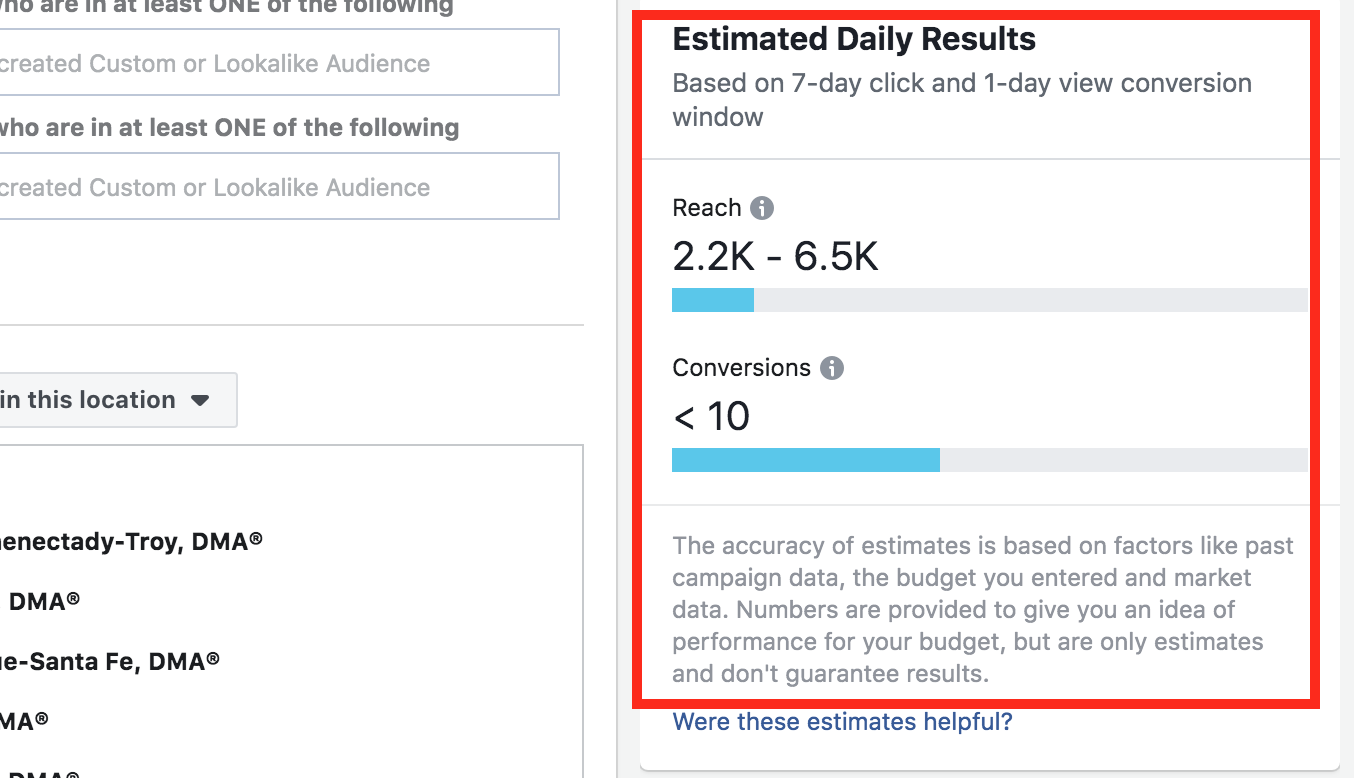
When you create a new Ad Set on Facebook, its traffic estimator tool tells you how much data it needs before its own optimization algorithms can make accurate decisions.
Google Ads does something similar.
Assess your results
If the conditions discussed above are met, you can assess your results. You’ll want to visualize the data in a way that makes it easy for you to measure the performance against your objectives.
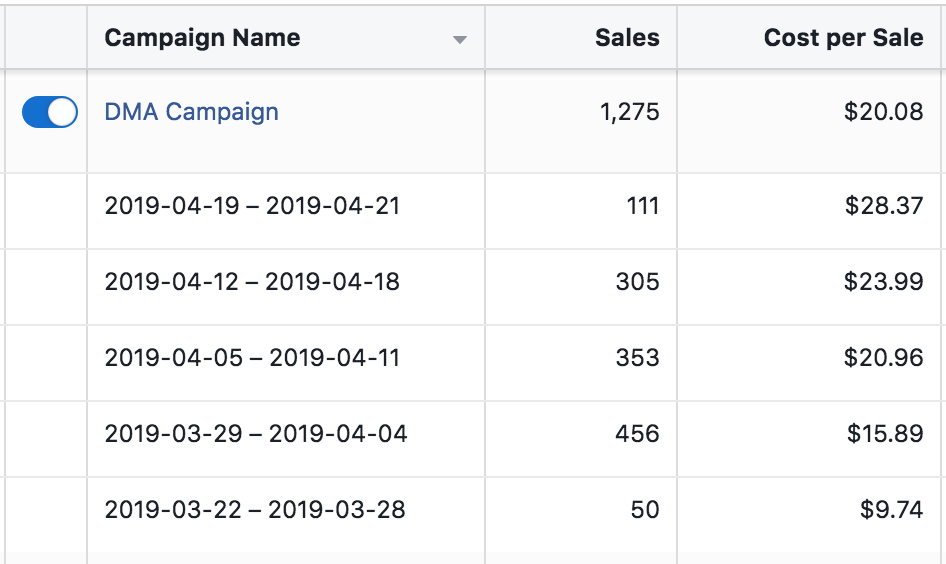
For Ronnie that meant segmenting by week because we wanted to see the performance trending over time. We didn’t want to bump up the budgets because of one good week or kill an ad because of one poor week.
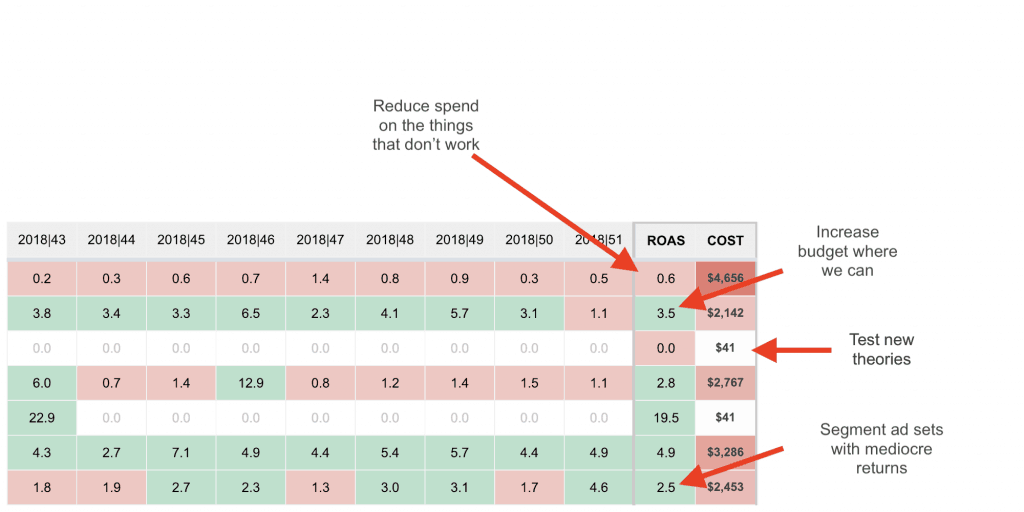
Your campaigns, Ad Sets, AdGroups, ads, or keywords will be in one of the following situations:
High spend > Perform above expectations
Low spend > Perform below expectations
High spend > Average performance
Low spend > Average performance
High spend > Perform below expectations
Low spend > Perform above expectations
Depending on your assessment of a campaign you might choose to:
- Gain more audience share.
- Reduce spend.
- Segment audiences with mediocre performance.
- Lower keyword bids.
- Test new ads.
- Try new audiences.
What you need to work out, is what action to take and why. Remember, you are making optimization decisions based on objectives and the data you have collected.
Then you can review the campaign and look for the variables that cause the changes.
Check out this useful cheat sheet for possible problems. Common Campaign Performance Drops
First: High spend > Perform below expectations
We want to focus on the campaigns that will bleed out their budget all over the floor before we worry about those that work.
Segment the campaign by the various variables and see if there are segments, audiences, ad sets or creative that work or that spend the bulk of the budget.
Use this cheat sheet to identify the various common optimization segments for campaigns.
If you are using a target big or target cost optimization model, you may have to increase that target or your budget to allow the platform to enter more auctions.
Or you may have to reduce the target or budget to stop in entering the auctions that have a lower chance of converting.
Second: High spend > Average performance
It’s easy to get complacent with the campaigns that potter along. They don’t really fail but they don’t make money either.
The problem is that campaigns like this take away your resources from things that could work. Check if there are particular segments, audiences or creative within the campaign that work well, then break them out. If not, I would kill the campaign and re allocate the budgets.
As described above, you may have to alter the target costs or budget settings to enter or leave more auctions.
Third: Low spend > Perform below expectations
Maybe you’re not spending enough budget for the proprietary algorithms to work effectively. They too need data before the algorithm can take action.
If you increase the budget is there potential to reach new people? If you have a small audience with only a few thousand people and your campaign has already reached a thousand plus people, increasing the budget won’t help.
If the campaign spend is already 3.5 X greater than the target cost per action increasing the budget won’t help.
Four: High spend > Perform above expectations
Squeeze as much out of it as possible. You will start by segmenting your campaign by the variables and seeing if there are any large audience segments that work particularly better than others.
If there are audience segments that are big enough you can break them out, increase the budget, and acquire more of the market share.
Five: Low spend > Perform above expectations
You have found something that works right now, you need to scale it. Review the size of the audience, saturation, audience share and competition. Can you increase your budget? Can you take the settings you have and broaden them to additional channels or formats?
Six: Low spend > Average performance
Why bother? Kill it and move on.
Acting On Your Observations
Because Ronnie and I had clearly defined our objectives at the beginning it allowed us to clearly map out our biggest short- and long-term wins.
- Maximize what was working.
- Cut what wasn’t working.
- Identify new opportunities.
I will break this post down into channel, campaign and audience optimization because these are the areas that people usually focus on.
Ad optimization is also very important but I’ve covered the process independently in a more detailed post on how to write a great ad.
How to optimize channels
Review your objectives. What are you trying to achieve? At the top level how do your marketing channels perform alongside one another to contribute to this objective?
A quick review of your web analytics data shows you the value of each channel in terms of conversion rate, number of transactions, and revenue.
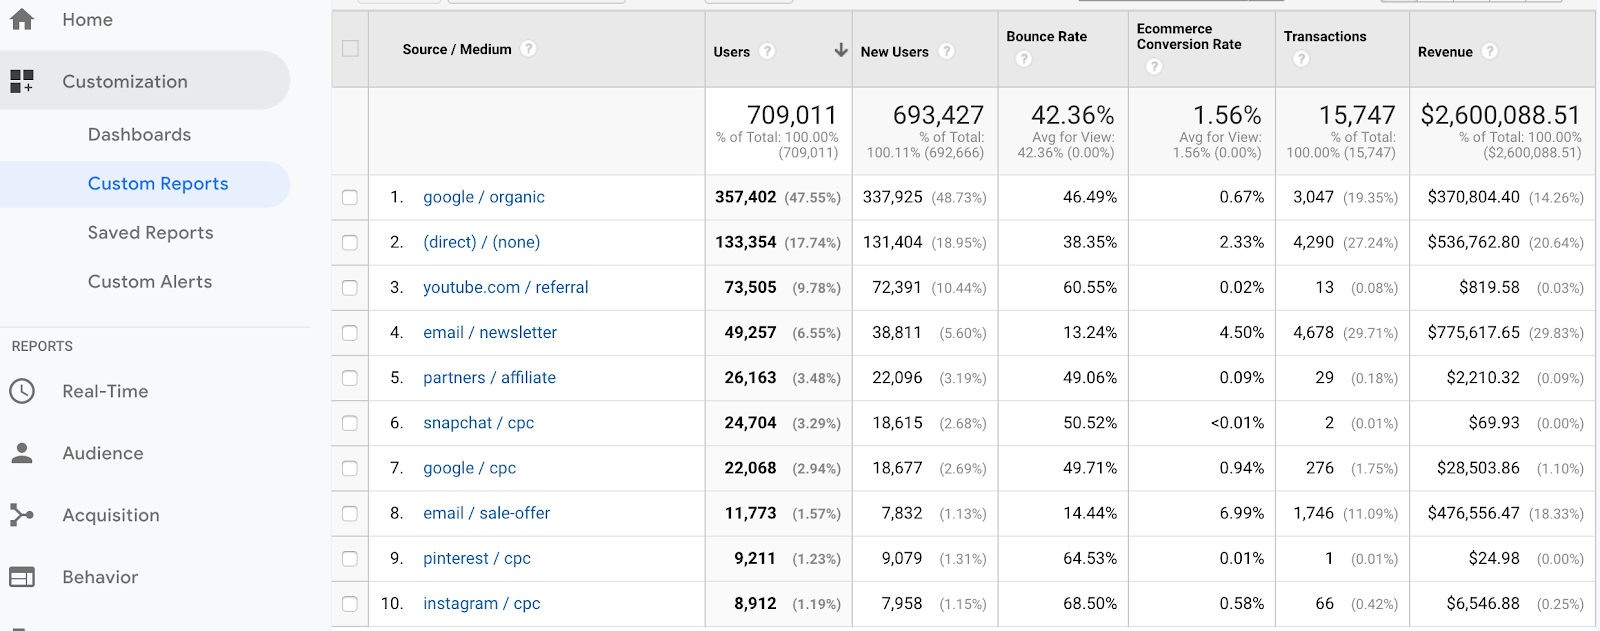
Google Analytics also includes a Lifetime Revenue per user report that you can use to better understand the long term value a channel brings you.
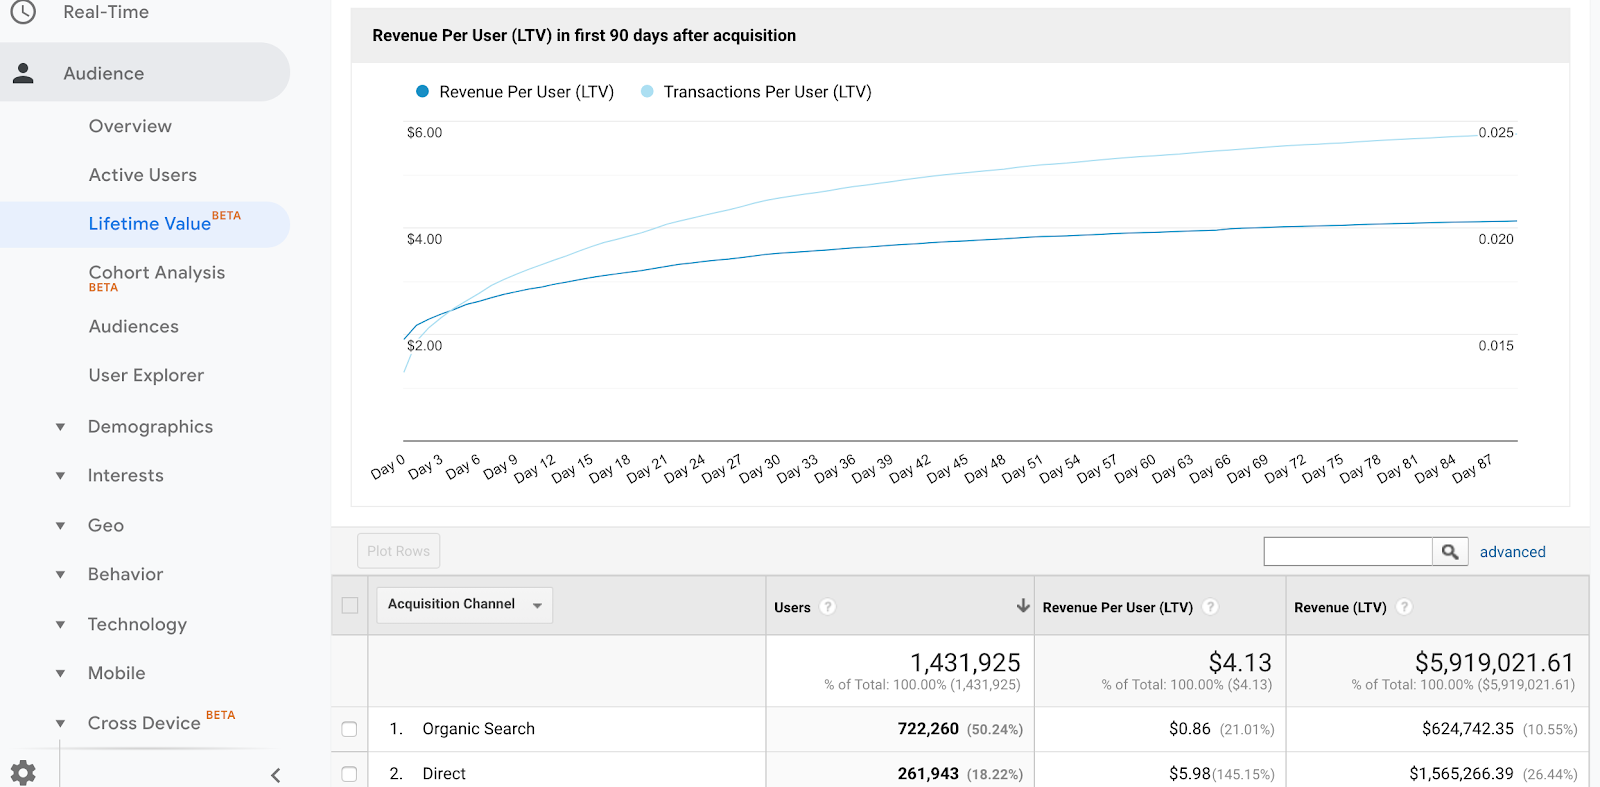
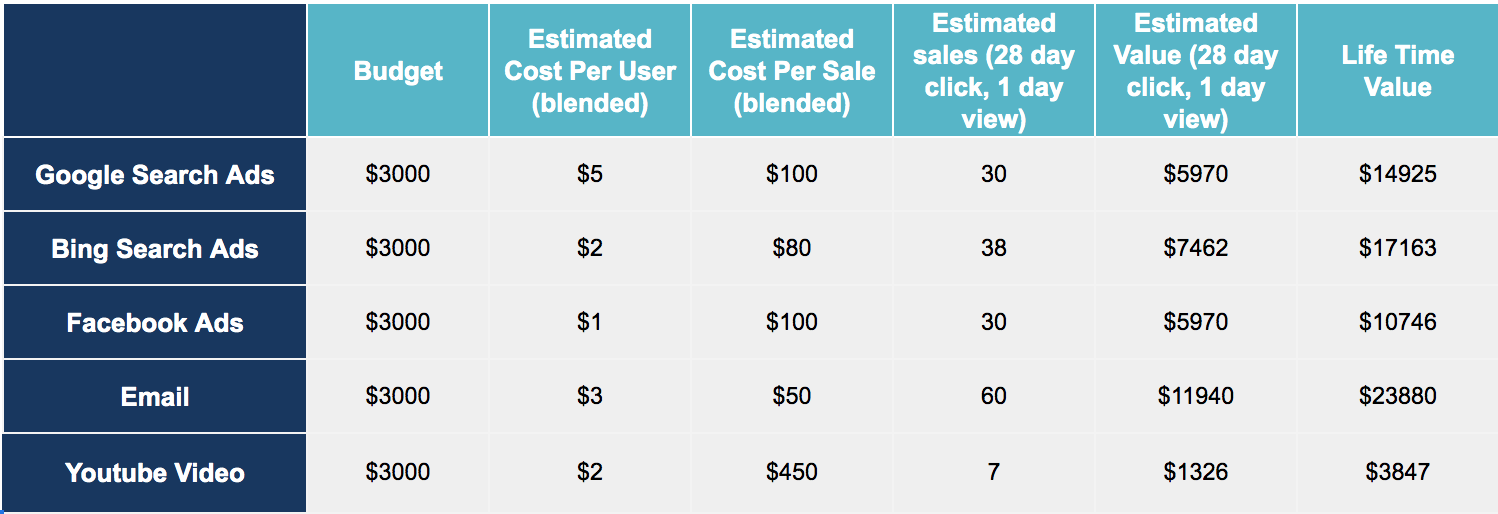
Ronnie’s cost per sale from Google Ads or Facebook Ads was around $100 but email converted much better and at a much lower cost. However, there’s a problem.
Imagine for a moment, you email your mailing list with your current offers. Some recipients make a purchase, we estimate 5%, some will not, we estimate 95%. And some may unsubscribe, we estimate 3%.
If you continue sending out emails to the same mailing list you will run out of potential customers on your mailing list.
So, to increase the number of customers on the Saveonit mailing list we had to use the attribution reports to work out which sources of traffic drove the newsletter signups and to invest more money here.
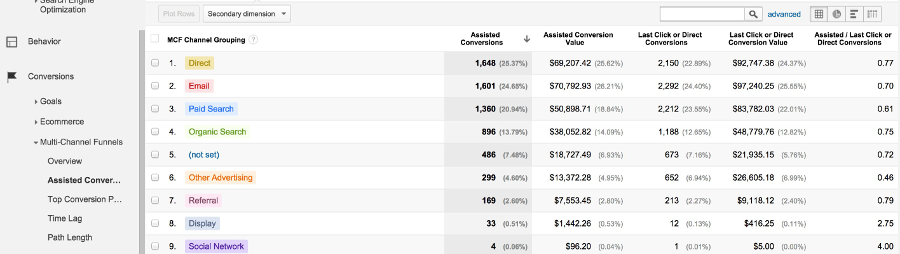
Before spending all your budget acquiring email subscribers, you should know that all the ad platforms will take credit for driving a conversion.
Let me explain…
There are channels at the beginning that will start the conversion and those at the end that will drive the sale. If Facebook starts a conversion and Google Ads closes it. They will both claim it as a conversion in their own proprietary reports.
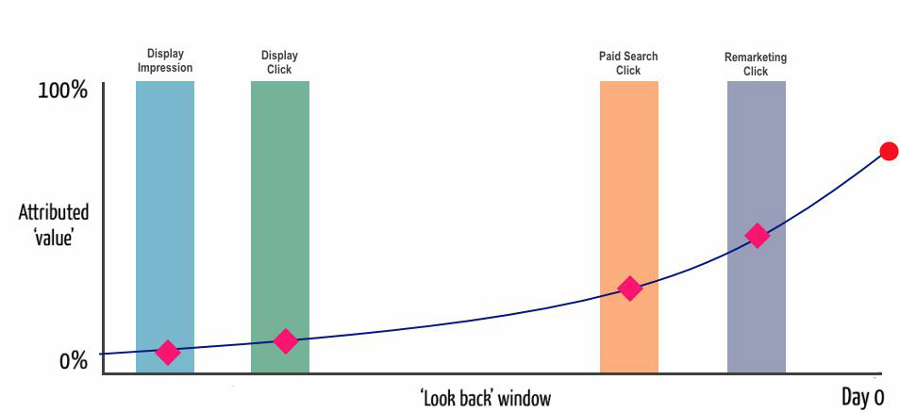
Your strategy could be to optimize the channels at the bottom of the funnel first like focusing on email, but then you will need work your way back up the sales funnel. Either way, you need to ensure that your most effective channels are fully funded before you focus your attention on something higher up.
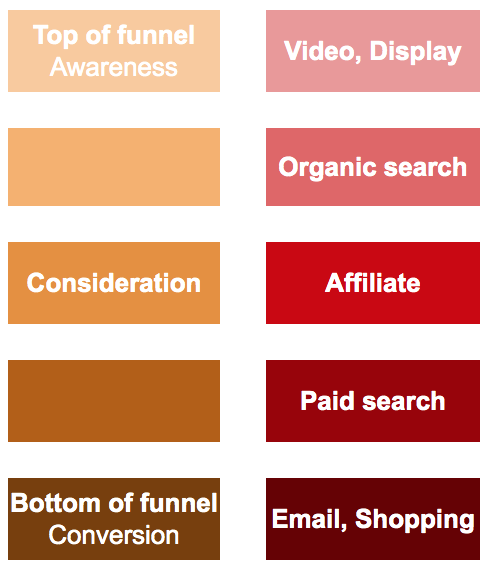
You’ll want to max out the reach and saturation of those lower funnel customers first.
In the early days, Ronnie only had a small budget and a huge audience of people actively searching Google for “Microsoft Office 2019”. So it makes sense for him to max out that audience before trying to spend money in the discovery phase.
- Which of your channels are drivers of new users at the top of the awareness, consideration, and buying phases. What’s the impact of those channels?
- Are those channels delivering a positive return on your investment?
- Does one campaign within a channel deliver a better average return than other campaign?
How to optimize campaigns
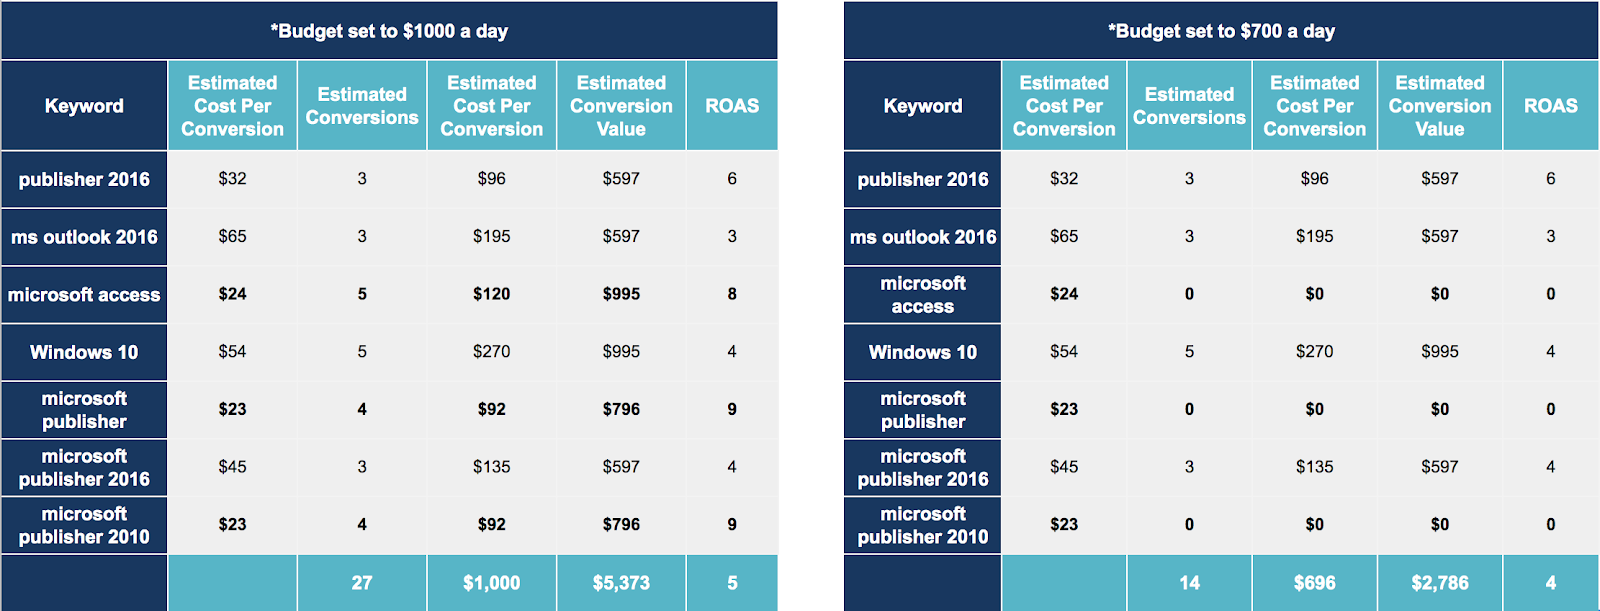
Before you review our campaigns, make sure you’re clear about where your campaigns sit in the conversion funnel, and the impact they have on the sales. Saveonit had a finite amount marketing budget, so it was important that the campaigns at the bottom of the sales funnel had were fully funded and those at the top would get whatever budget was left.
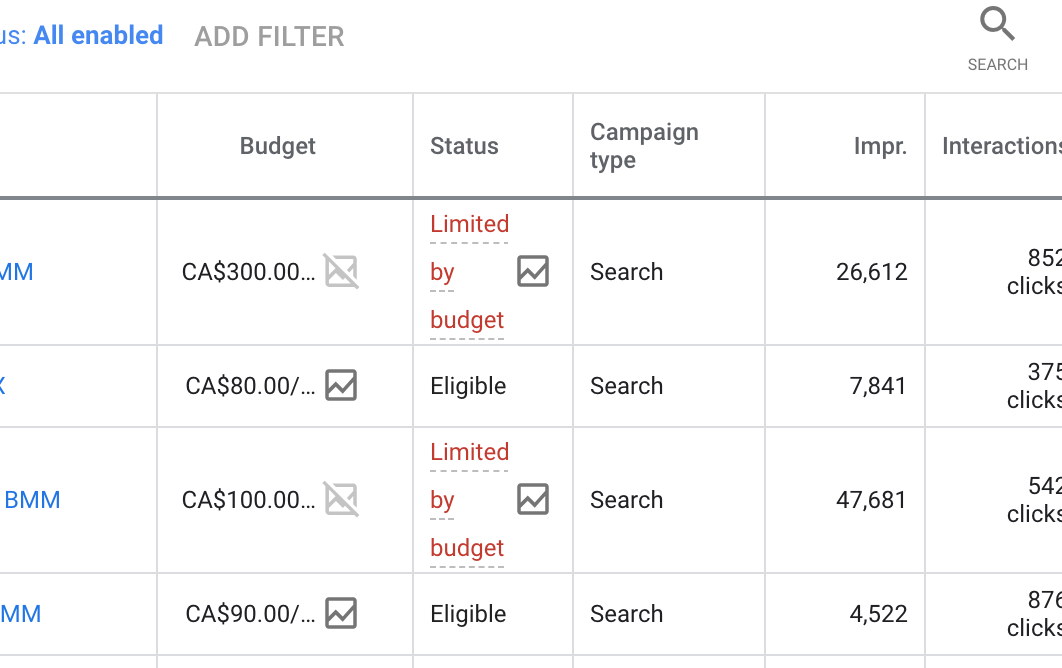
Google Ads will tell you if you need to increase your budget. Facebook will try to optimize within the budget it has.
The reason is that if a Google or Bing Search campaign contains a handful of keywords which range in their cost per conversion, you could be running out of budget before the end of the day, or spending your budget on poorer performing keywords.
The challenge with Facebook is that as long as Facebook’s algorithm deems you have a quality campaign it will try to keep spending your budget. But you will end up reaching people less and less relevant to your campaigns and so the costs may increase.
How to optimize your audiences and keywords
One: High spend > Perform below expectations
Did it work before? If the audience you’re targeting used to work and performance has dropped, you have probably saturated the audience.
Saturation is not an officially defined term but refers to the tendency for campaigns running against a constant audience target to reach a point of rapidly diminishing returns. For example, saturation could be observed by the number of weekly sales dropping from 1,000 to 100, or the first week return on ad spend dropping by 50%.
Users in the audience are grouped by a particular behavior or characteristic that is deemed valuable to the advertiser. For example an audience on Google Ads maybe grouped by the keywords they use to search for products where as your Facebook audience may be grouped by certain demographic traits.
As the platform shows ads to people it measures their sentiment towards it through a number of different methods. Unless that audience group is growing the number or people within it that have not seen your ad shrinks and the number of times people sees the ad increases.
If this is a problem you are experiencing you have a few options. The first (which often seem counterintuitive in these situations) is to spend more. If you’re using a bid cap or target cost you can try raising your bids. If you are using a lowest cost bidding optimization model, then try increasing your budget.
Raising your bid or target cost will enter you into more auctions. You’re giving the platform permission to charge you more which will push up the cost for everyone else and allow you to reach more people.
This isn’t a long-term option though. It will increase the cost to you for each user which will eat into your margins. Basically, it doesn’t improve the quality of your campaign or the people you are showing your ads to so it’s only a short term win.
The first place I would recommend looking at optimizing before anything else is your ads. How to write a great ad.
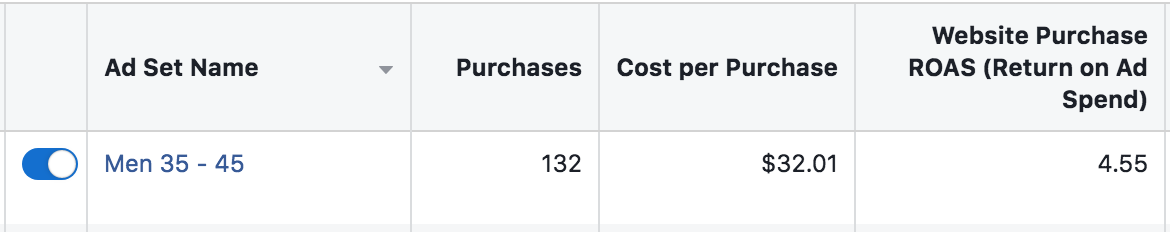
Next, segment the audiences. Break them apart and look for the segments within them that do work and cut out the parts that don’t. If you have saturated an audience you may find that by simply removing a targeting restriction like age, gender or location you unsaturated it and performance increases again.
A recommendation that I received from a Facebook Technical Rep was to run a branding campaign. Well, more specifically a traffic campaign. I was really against it because I didn’t want to buy cheap clicks, I wanted qualified customers. To my surprise it worked really well.
Running a branding campaign can help prime customers to respond to your ads, and in doing so, tackle a root problem in the cause of saturation: low brand awareness. This results in low clicks and low purchases which in turn the algorithm will penalize you for.
Two: High spend > Average performance
I recommend starting with the steps I described above. You either have to segment. may have to increase your send further
There’s a balance. If your campaigns are under funded, you’re leaving sales on the table. If your campaigns are overfunded, you’ll start driving up the cost.
Let me explain…
Imagine there’s a pool of 100 people you can sell to.The first 50 are easy to reach so you can show them ads cheapy and drive cheap sales. The next 25 are harder to reach and we are also competing with other advertisers to reach them. This makes it more expensive. The last 25 are the hardest people to reach. They have the most competition from advertisers and therefore are the most expensive.
You can estimate the size of your audience pool and see how many are seeing your ads for the first time using Facebook’s first time impression ratio tool.
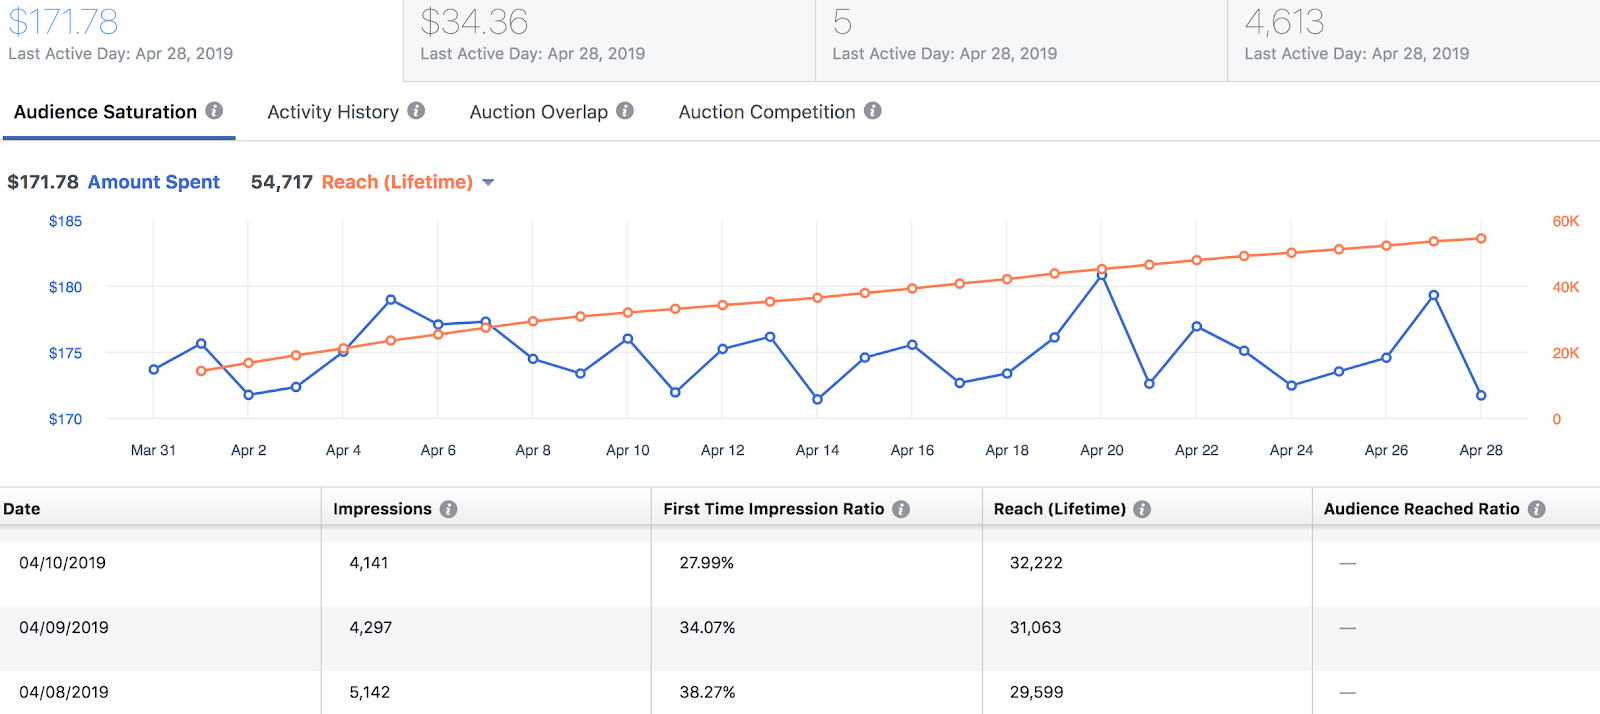
You’ll notice early on in the campaign, everyone that sees your ad is doing so for the first time, but that number start to drop as you reach saturation.
For the research part, we used our data and visualizations to show us what worked.
Segment the data, is there an audience segment that delivered a better or worse return than the average?
Increase budgets and or bids on the parts that work.
Three: Low spend > Perform below expectations
Do you need to spend more, you could increase budgets, target bids, target costs.
High spend > Perform above expectations
Segment, scale it, move the lessons into new campaigns and channels.
Low spend > Perform above expectations
Scale it!
Once you’ve started identifying where the opportunities are, you’ll need a way to scale them.
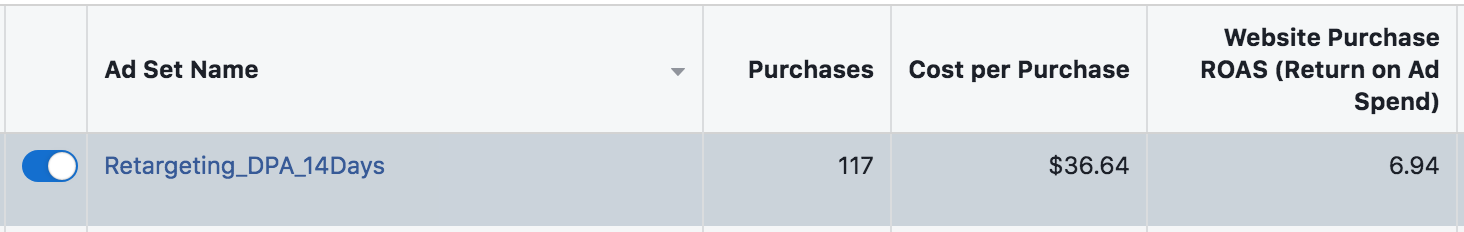
Some products or services that you advertise may have different margins or performance targets. I recommend adding them to your campaign and ad set names. You can see in the example below I have added my targets to the name of the adset for quick reference.
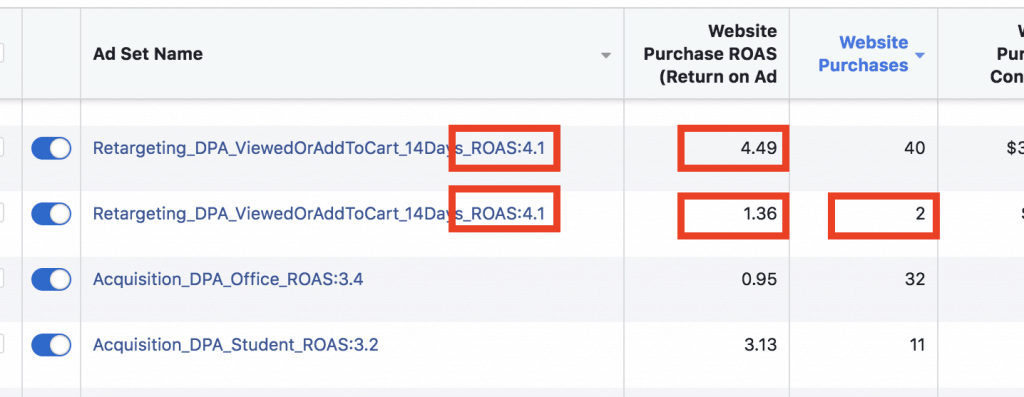
Alternatively, the objective of your campaigns may vary. For example, we would expect an own brand campaign would have a much higher conversion rate and lower cost per lead compared to a more competitive generic campaign. With that in mind you can also add your target ROAS or conversion rates to your campaign or ad set names. It will make it much easier for you to see what’s under or over performing at a glance.
You can get access to both of these optimization reports here.
Four: Low spend > Average performance
Kill them! Kill them all.
How to optimize your ads
Ad optimization is another ball game, read my blog on How to write a great ad it’s packed with tips and tricks.
Templates Used in This Post
Planning worksheet
ROAS worksheet
ROAS Calculator tool
Yearly Target ROAS
Funnel Resources Data Worksheet
Common Campaign Performance Drops
Common optimization segments
Optimization reports
This post is part of a series to help marketers better understand their data. If you would like to see a change in the way you start optimizing your campaigns, it begins with a conversation. Reach out to me at mike@knowndigital.com.
- You may like: How To Write A Killer Ad