Have you read any “How To A/B Test” case studies recently, and did it leave you with more questions than answers?
Most case studies leave out the critical thinking that goes into a successful A/B test. The author rarely explains how they did the A/B test, and most frustratingly they leave out the raw data so you can’t do your critical analysis.
To be fair, their test probably wouldn’t work for you anyway, there are too many variables at play. For a start, A/B testing isn’t a sprint to the finish and exceptional wins are very rare.
Second, they’ve probably been through countless iterations and discoveries before calling it a winner.
The good news is that I am going to show you how to A/B test by following the data and using a robust process. You won’t need to copy anybody else’s case studies. You’re going to know how to do this yourself.
Initiation of your A/B project
I think it’s always important to remember why you’re doing this. There’s a reason you’re A/B testing and not just making changes on a whim.
Marketers need to make decisions every day on where to spend more time, money, and resources, but making the right decision is hard.
If you have a lot of industry experience and have access to the data you need to make decisions, you should be less likely to make bad decisions.
The problem is that there’s always the risk that you get it wrong. If you don’t have enough data to make a decision or the cost of getting it wrong is too high, you could end up with decision paralysis. You fear to make a decision, so you make no decision.

Download the Risk vs Reward tool for yourself.
So why do we fear getting the decisions wrong? Probably because we mistake assumptions for insights. Your assumptions are what you believe to be true, whereas insights are proven facts that we can rely on to be true.
A/B testing is just one method that a business can use to turn an assumption into insights and calculate the risks of making one decision over another.
Should you be A/B testing?
I’m an advocate of A/B testing, and an ad optimization specialist, however, optimization does not begin and end with A/B testing.
If you’re not spending a lot of money on ads, or your ads don’t get many impressions, A/B testing may not be the best method of optimization for you.
When it comes to A/B testing, the recommended best practice is to test against a representative sample of your audience. So, if you do not have enough traffic to create a representative sample, then you may see more success and better results from qualitative research like user interviews and hands-on testing.
A larger sample size should, in theory, mean more accurate results, but be careful. When it comes to surveying large populations, bigger isn’t always better. We’ll discuss this in more detail later.
Don’t fall into the trap of bumping up your audience size by letting tests run forever. You cannot just extend the length of your test to ensure you have enough traffic. By increasing the time you increase the variables and therefore, the risk.
Use A/B Test Duration Estimator This spreadsheet will show you how long your tests should run for an accurate result.
When it comes to testing, the results will always have a level of uncertainty, but the fewer the variables, the more confident we can be in the results.
Check how big an audience you need with the audience size calculator. This tool will show you how big an audience you need and how long you will need to reach a statistically accurate result.
If you’re in a position where you’ve got a good stream of traffic and the resources to do some investigation, let’s begin!
Set your key performance indicators
When starting an A/B test, it is essential to define what the business goals are, and then you can determine the KPIs that best feed into your goals. Some of these KPI’s will have a more significant impact on your bottom line than others, but they all have their purpose.
- Return on ad spend
- Conversion rate
- Click through rate
- Engagement
- Cost per acquisition
Although not tied directly to revenue, click through rate and engagement are still very important KPIs. For both Facebook and Google’s platforms, the better the expected performance of these metrics, the lower your costs.
Researching opportunities
You may have no idea where to start, or potentially, you already have some great ideas that you want to test. Either way, it’s essential to spend a little time researching so you don’t miss the big opportunities sitting under your nose.
I begin with a heuristic analysis for speed. Then a quantitative analysis of the data sources. It is followed by a qualitative study to gain a better understanding of underlying motivations behind the numbers in the quantitative analysis.
Heuristic analysis
An experience-based assessment is fast and brings focus.
This analysis is based on opinion, something we are trying to get away from, but – the opinion of an experienced optimizer matters a lot.
The experience the optimizer has gained from hundreds of hours optimizing means they can make more accurate predictions than someone with minimal optimization experience. For example, an experienced art dealer could more accurately guess the value of a painting than a random person on the street.
The analysis is done in an organized, structured manner, variable by variable, based on our experience of what we’ve seen before. It’s appropriate to include your fellow designers, user experience specialists, and copywriters.
It’s important to remember that we’re not going to find facts. We’re finding the areas of interest that we shall seek to validate or invalidate in our qualitative and quantitative research phases.
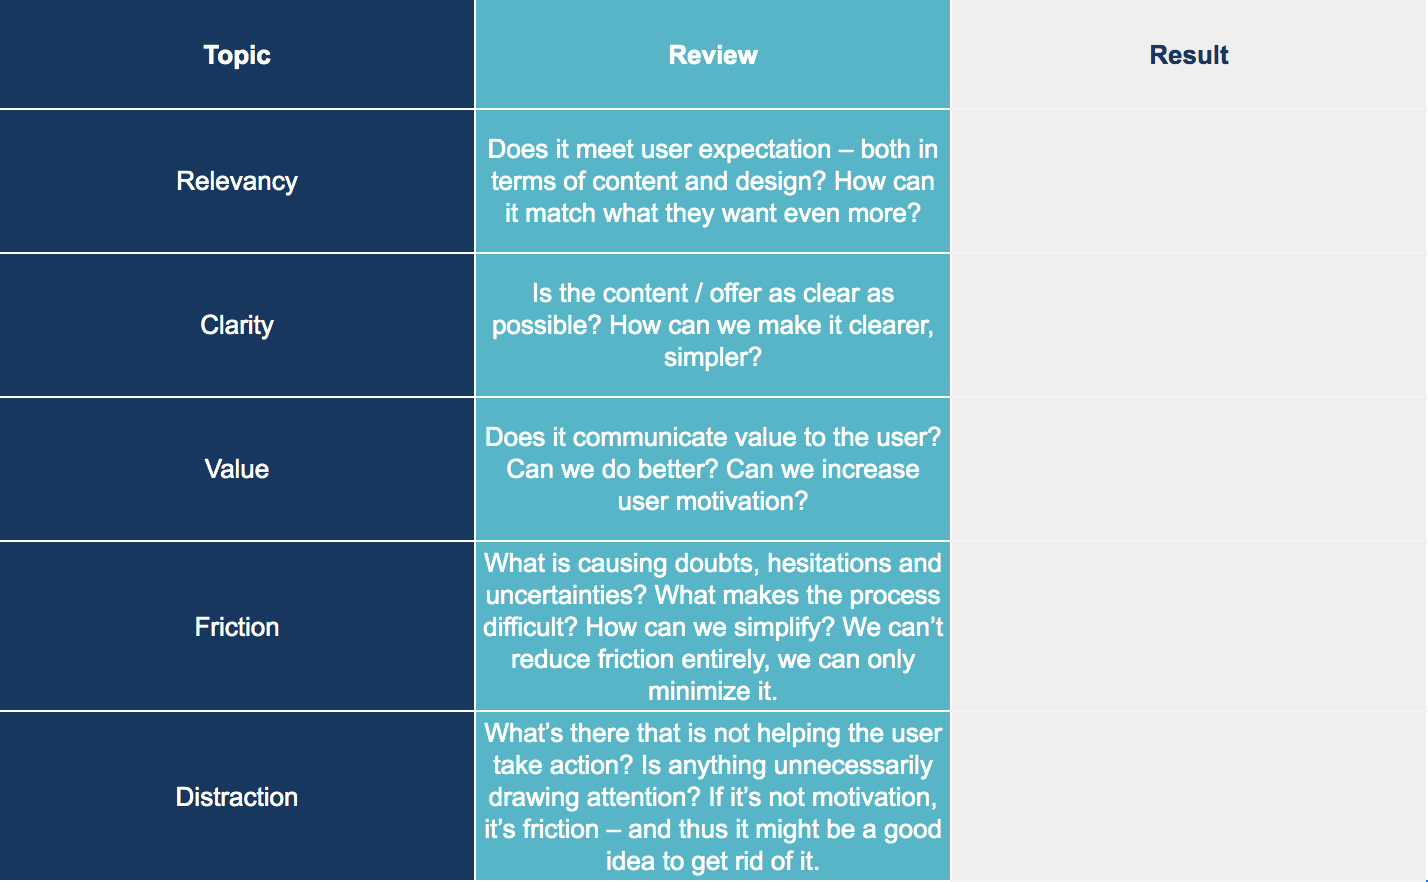
Use the structured analysis data sheet to guide your heuristic analysis.
Quantitative research
Your analytics data is a great next step. Using tools like Google Analytics, Facebook Ads, or Google Ads, you’ll be looking for opportunities. Areas where the traffic volume is high, but perhaps your conversion rates are low. Why does one ad convert at such a high rate, but another doesn’t. Your quantitative research phase will help you develop broad theories from which you can build a hypothesis. Here are some things to look for:
- Is the cost per landing page view abnormally high?
- Are our engagement rates low?
- Could the conversion rate be higher?
Things like cost per user and quality score are often overlooked because they don’t directly impact the bottom line, but these are great things to prioritize.
Not only do they serve as a useful benchmark KPIs, but they can also ultimately help you make optimizations faster.
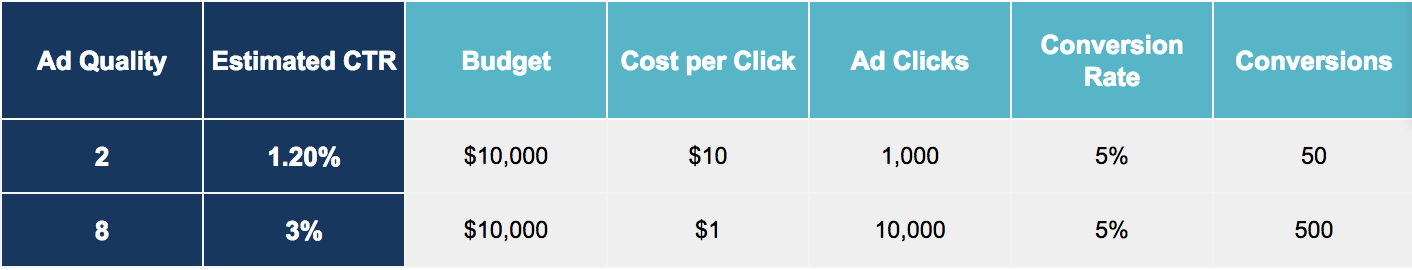
Let me explain… You want more conversions but to do so, you need more traffic so you can test faster and against bigger sample sizes.
The problem is that buying clicks at $10 a pop is expensive. It’s a catch twenty-two. Instead, focus on reducing the cost of acquiring a site visitor. If you can reduce the value of your visitors, you can increase the volume of data from which you have to learn.
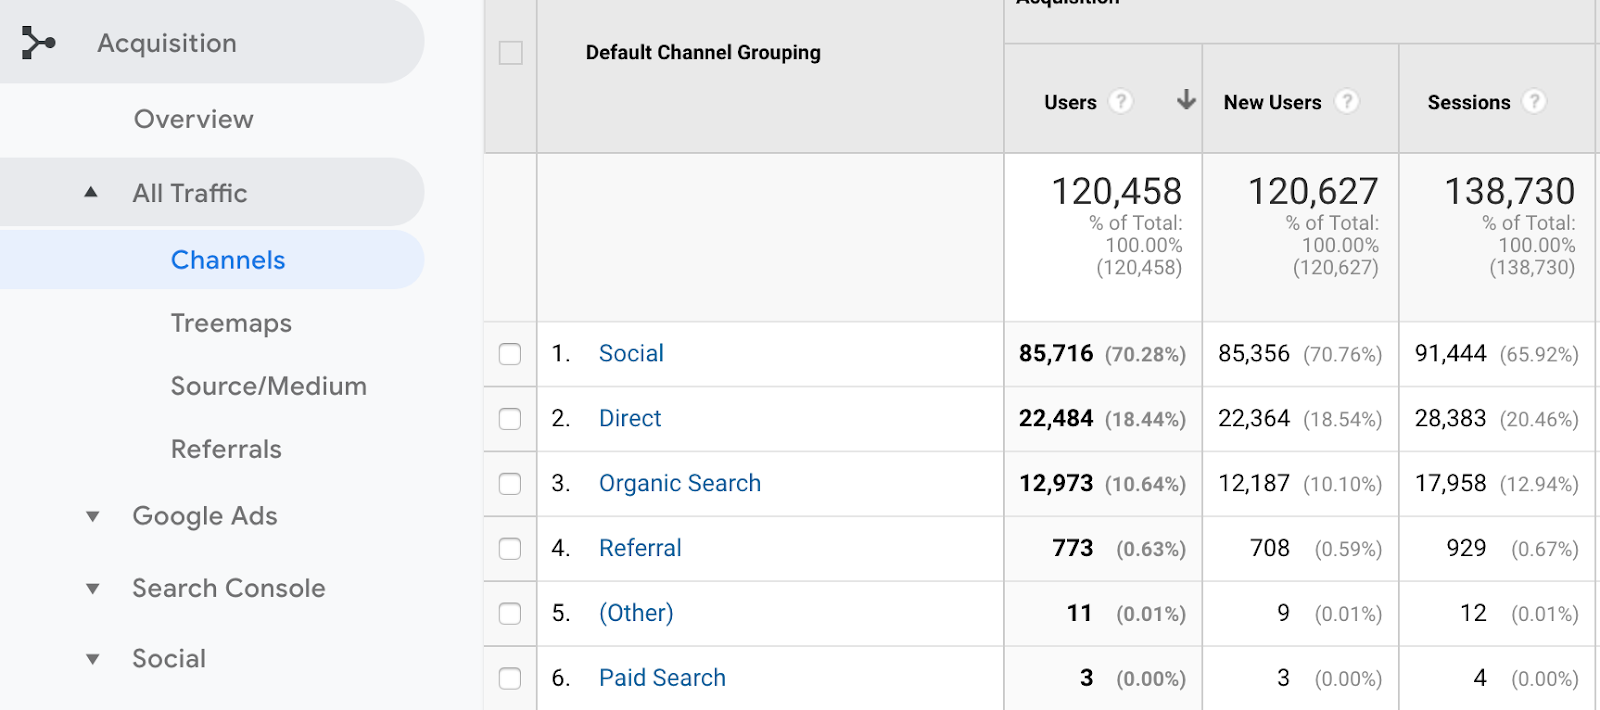
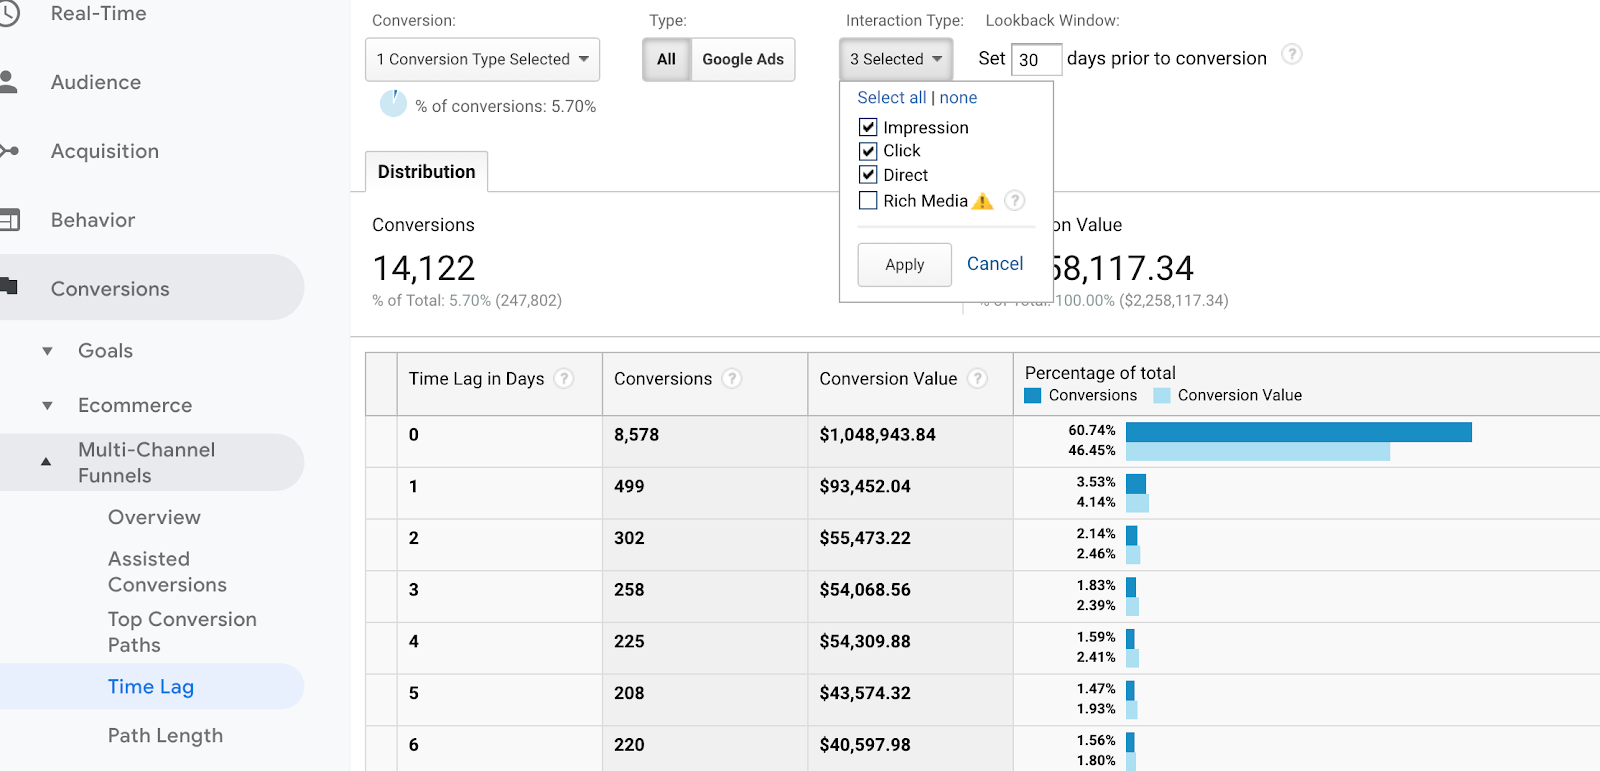
Use the Google Analytics Traffic Sources report to identify the top sources of traffic and the most significant opportunities.
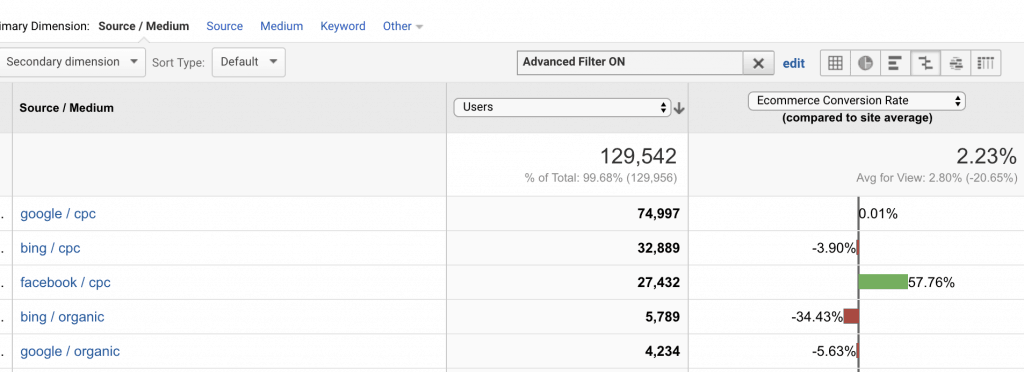
Or the Google Analytics Comparison Chart to identify traffic sources that perform below the site average.
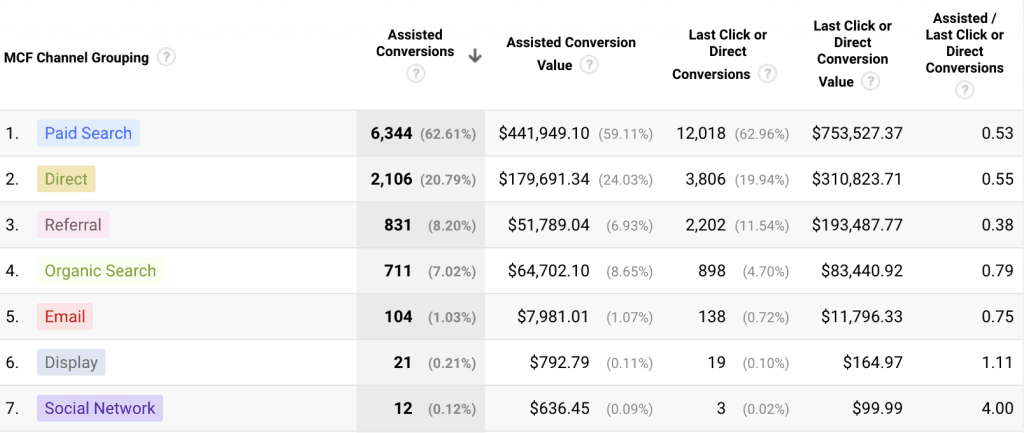
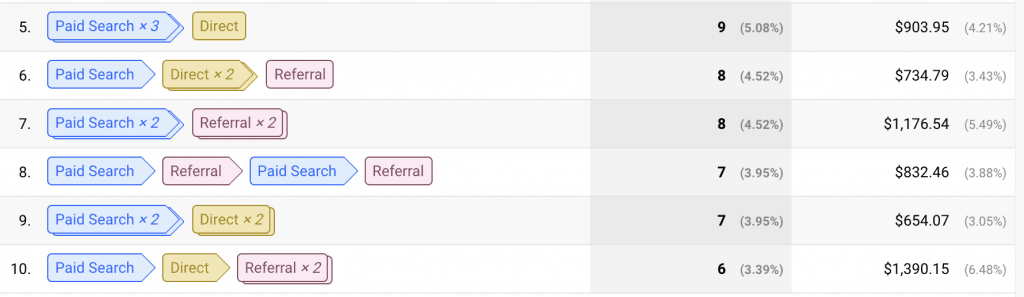
Dig into the Assisted Conversions Report to summarize the role each channel plays in the conversion path. Which channels start the conversions, end them, and assist them.
Open the Top Conversion Paths report. It shows the conversion paths that lead to sales and the number of sales from each path. Are there repeated patterns which give insight into the customer flow through the website?
The data from your quantitative analysis will reveal what your audience does and how it behaves, but it won’t tell you why your audience behaves like that.
Use quantitative analysis to focus your attention on what to test.
Qualitative research
Customer observations, interviews, and focus groups are all great sources of qualitative data, but numbers can’t replace a conversation with your best customers. Pick up the phone, email them and utilize messenger to start conversions with them.
- What were their biggest hesitations?
- What did they like about the experience?
- What didn’t they like about the experience?
- What did they hope to achieve?
- Why did they click on this ad?
You can ask them to narrate their thoughts and actions. This will help to identify if your ads are tools for sales or if they are considered spam.
Next, put on your customer’s shoes. From what you learned about your user journeys navigate through the sales funnel. Can you find any broken elements of your user journey?
- Do your ads display the message as you want them to across all channels?
- Do your landing pages load as you want them to across all devices?
- Do your ads work on all formats (messenger, stories, the display network, etc.)?
Deciding what to test
Click to download the ideation and outcomes template.
Ideally, your research should have sparked some thoughts. You’ll probably have ideas around what channels or landing pages to test, and against which audiences but you’ll also need to narrow down what to test.
If you’re like me, and your work is based on performance marketing, try focusing on the ads, targeting, and landing pages.
Here is a quick and dirty list of variables you can focus on:
- Captions
- Headlines
- Targeting
- Creative
- Call to actions
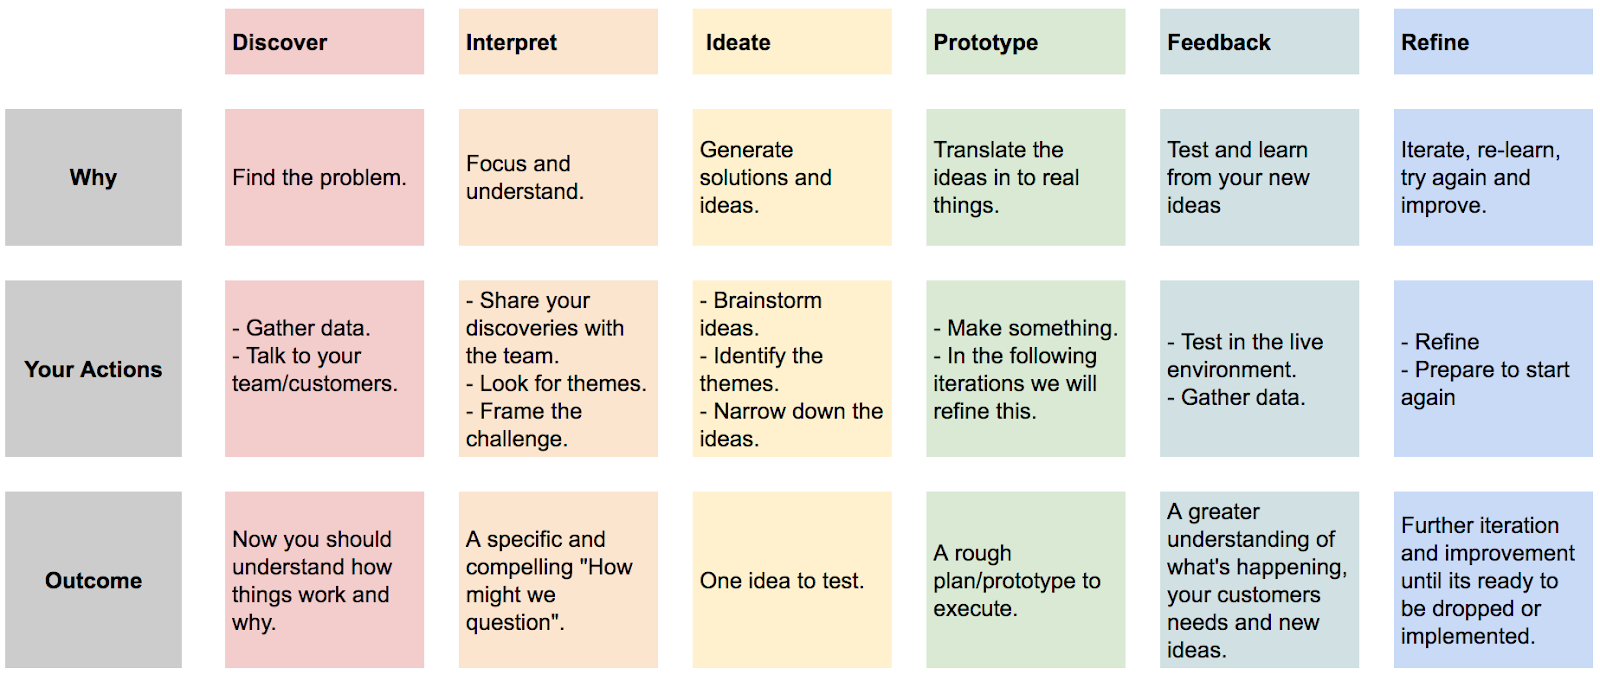
Ideate & describe
Try to define the problem and the potential solutions to your discoveries.
Prioritize your tests
When you have identified the variables you want to test, you’ll need to work out which ones should take priority. You can’t possibly test everything at once, so we use a framework to prioritize our most significant opportunities.
There are some common prioritization frameworks you can follow, like ICE and PIE.
ICE works by scoring your ideas against their impact, confidence, and ease to implement from 1-10. For example, if your confident this test could have a significant positive effect, and you could quickly run the test by yourself, you might score it.
- Impact: 9
- Confidence: 9
- Ease: 8
If this test scores higher than anything else you came up with, start here.
PIE works similarly but scores your ideas against potential, importance, and ease. If the test will reach 90% of your audience, you might give Importance an eight.
The problem with both of these prioritization frameworks is their reliability. They’re subjective, which introduces risk. Something the ConversionXL PXL Testing Framework tries to reduce.
PXL is a little different and more customizable than PIE and ICE. It forces more objective decisions.
Instead of three factors, you’ll find yes/no questions and ease of implementation questions.
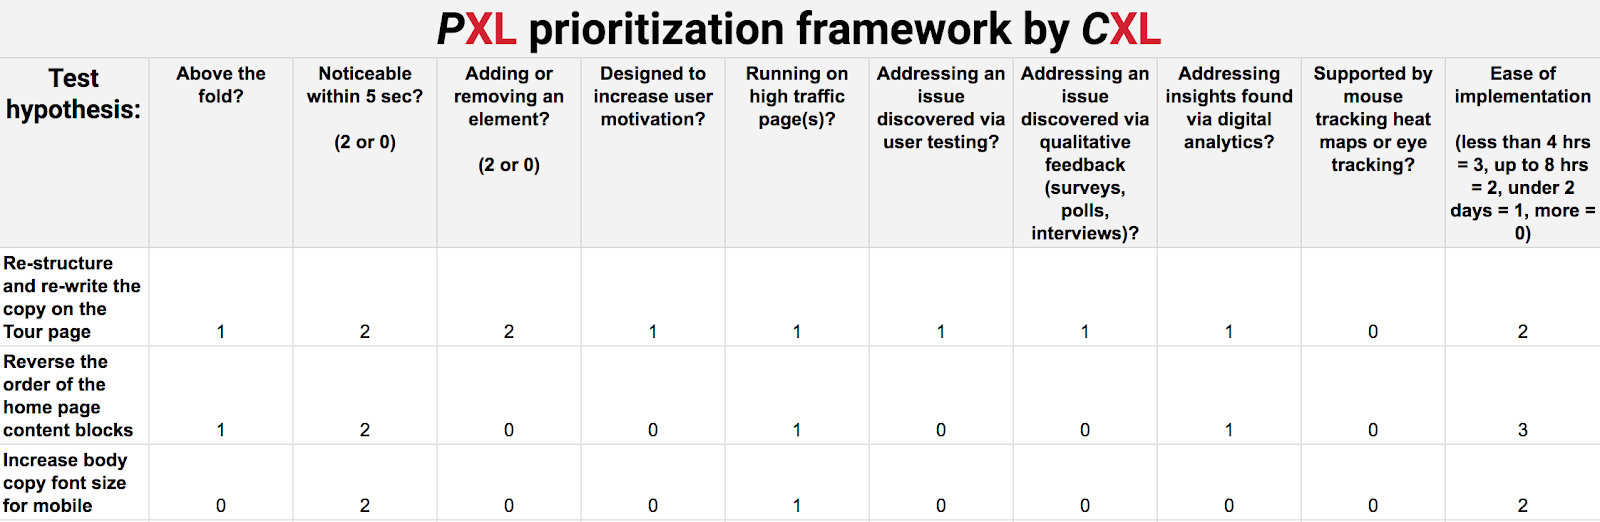
Grab your own copy of this spreadsheet template here. Just click File > Make a Copy to have your own customizable spreadsheet.
The PXL framework ensures the “potential” and “impact” ratings are more objective and rely less on opinion.
Your aiming for test ideas that will have an impact on the user’s behavior and this framework instead of guessing what the result might force you to answer fact-based questions.
- Is the change above the fold? Above the fold, changes will increase the likelihood that the test will have an impact.
- Is the change noticeable in less than 5 seconds? Can a control group can tell the difference in less than 5 seconds?
- Does it add or remove anything? More significant changes will likely have a bigger impact.
Designing a test
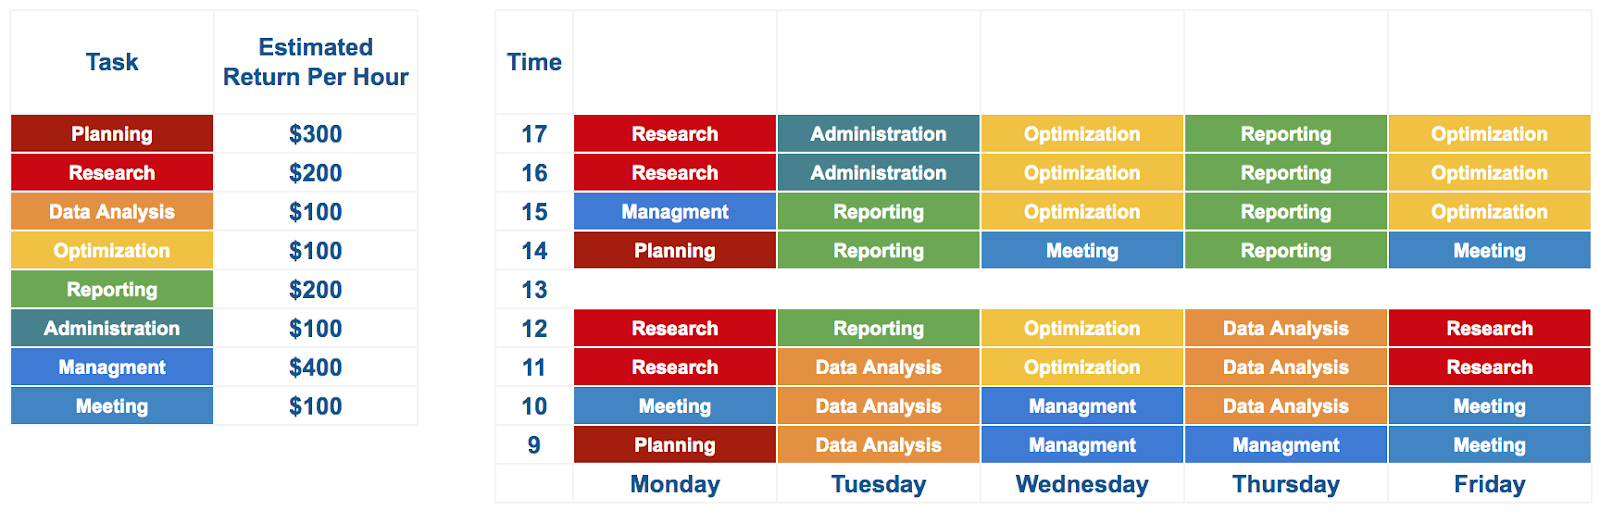
A/B test matrix
Based on the prioritization framework you choose you should have a list of tests you wish to execute over a given period of time. I like to build these out into a testing matrix. This allows me to easily keep on top of the tests we are running and quickly asses what worked.
Responsibilities
Depending on the requirements for these tests you may need a designer, a copywriter or a developer to help you implement them. Ensure everyone involved knows their role within the project. Who is responsible for:
- Designing
- Building
- Signing off
- Setting up
- Testing – broken tests are by far the most prominent A/B test killer, make sure it works without error across browsers and devices.
- Monitoring
Variations
When running an A/B test, never test a variation after you’ve tested the control. You should always test both versions simultaneously. If you test one version one month and the second the following month, you will introduce variables, and these variables are increasing the risk.
Always split your audience between test versions. You need to ensure your test subjects see the correct variation of your ad, or landing pages each time they encounter it. If they end up seeing each version how can you really test which one worked? The tools you use should incorporate a mechanism for remembering which variations a visitor has engaged with. This prevents blunders, reduces variables and keeps your brand professional.
Create a sample audience
Your audience sample size must be calculated up front before your test starts, and I recommend using a sample size calculator to work out the minimum sample size.
Check how big an audience you need with the audience size calculator. This tool will show you how big an audience you need and how long you will need to reach a statistically accurate result.
If you increase your sample size you’ll have less variance. The larger the sample size the less variability there will be in your data set and so the more accurate the mean will be in predicting an individual data point.
Once your A/B test has started, it can’t stop until the predetermined sample size is reached, even if it reaches significance. If it stops halfway through, it’s invalid.
Tracking and measurement
Yes, seriously, set it up.
How long to run your test
I’m frequently asked how long a test should run for. It’s one of the most complicated and important parts of A/B testing. Also, one of the most interesting.
First, If you stop too early, you risk losing meaningful results which could have come later on in the test. Second, If you run for too long, poorly performing variations could cost you conversions and sales. Finally, If your sample size isn’t large enough to be statistically accurate, no amount of time will yield accurate results.
If you’ve started using an A/B testing tool, you’ve seen the term “Statistically Significant.”
Beware. Just because a tool or the math tells you a result is statistically significant does not mean you should stop the test. As you’ll learn later, statistical significance is not a stopping rule.
Before you launch a test, you’ll need to work out your predetermined sample size. It’s not as complicated as you might think.
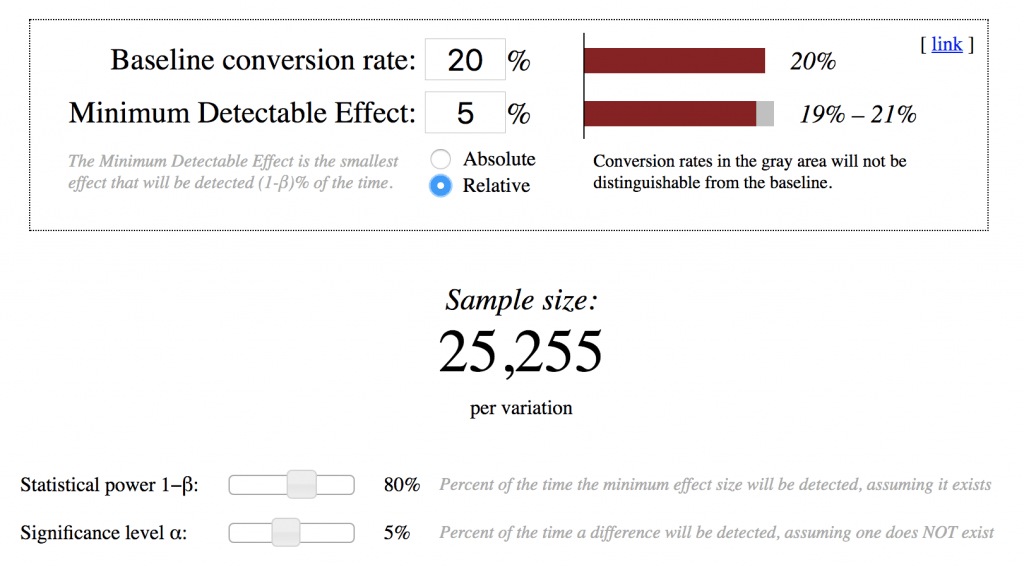
You can use a sample size calculator, like this one from Evan Miller.

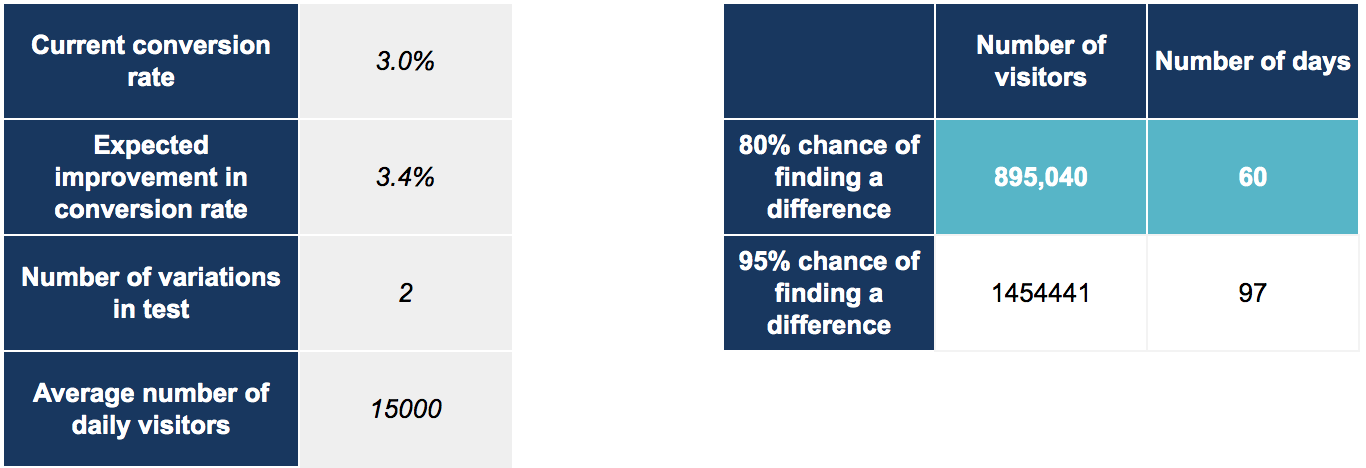
If for example your current conversion rate was 20% and you needed to detect a 10% effect, for each variation you need to deliver over 6,347 users. That means you need over 12,000 visitors in your sample.
Use the audience size calculator to estimate how long the test will need to run.
If you wanted to reduce the minimum detectable effect (MDE) detect a smaller effect and from 10% to 5%. You would need a sample of 25,255 per variation.
So, if you have delivered fully to your predetermined sample audience and have reached a statistically significant result, we can be more confident in our outcome.
Business cycles
Consider the following when deciding how long to test for:
- How much time it will take the buyers to make a purchase.
- What anomalies like holidays and promotions could affect the test.
- Does your business have a natural cycle, like monthly or quarterly invoicing.
- How long will it take to reach the required sample size?
A good rule of thumb is to test for at least two full business cycles. You can use Google Analytics to work out your business cycle.
Stopping your tests
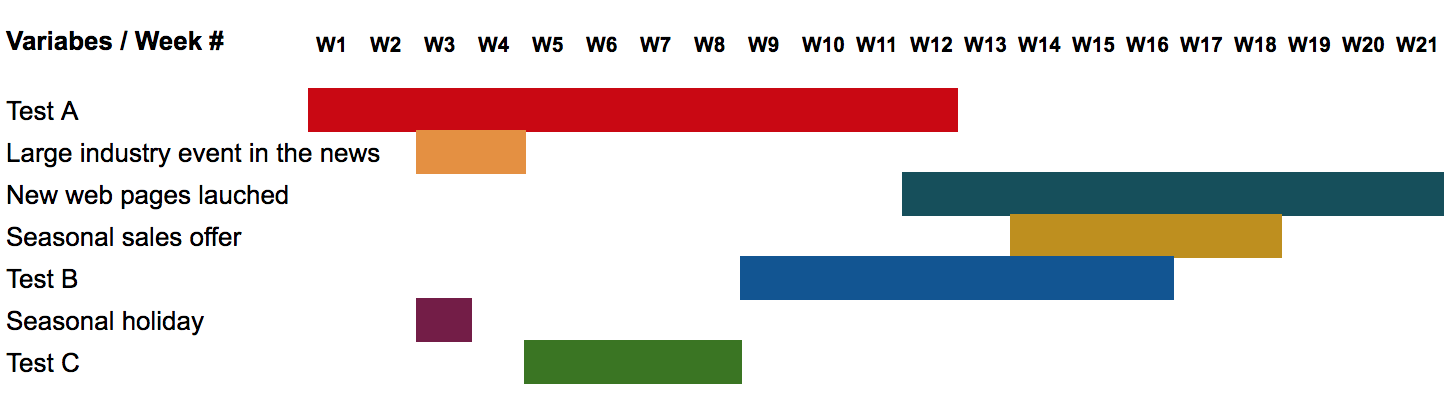
To understand when best to stop an A/B test, it’s helpful to review a hypothetical one. In this instance what impact a sales offer has on conversion rates.
When we conduct this A/B test, we are often comparing two hypotheses:
- The null hypothesis predicts that our sales offer will not have an effect on our variable. For example, the null hypothesis is that the conversion rate will remain the same regardless of the sales offer.
- The alternative hypothesis predicts that you will find a difference in performance between offers.
With any statistical test, there’s always the possibility that you will find a difference between groups when one does not actually exist. Likewise, you may also find that when a difference does exist, the test will not be able to identify it.
Statistical Power
Statistical power refers to the probability that your test will find a statistically significant difference when such a difference exists. Power is the probability that you will correctly reject the null hypothesis when you should.
- The lower the power, the bigger the chance that a winner will go unrecognized.
- The higher the power, the lower the chance that a winner will go unrecognized.
80% statistical power is the standard for most A/B testing tools.
Next, if sales offer A and sales offer B were exactly the same, how often would you see an effect just by dumb chance?
Use this calculator to work out the statistical power.
Statistical Significance
We use statistical significance to prove that the relationship between two or more variables is caused by something more than just chance. For example, if we set our statistical significance level on the lower end, there’s a bigger chance that we get a winning variation.
In our example, lower statistical significance means that we increase the risk that the wrong sales offer is declared a winner.
At the beginning of an A/B test, extreme fluctuations between variations are common. This could be a regression to the mean.
Working with Statistical Significance:
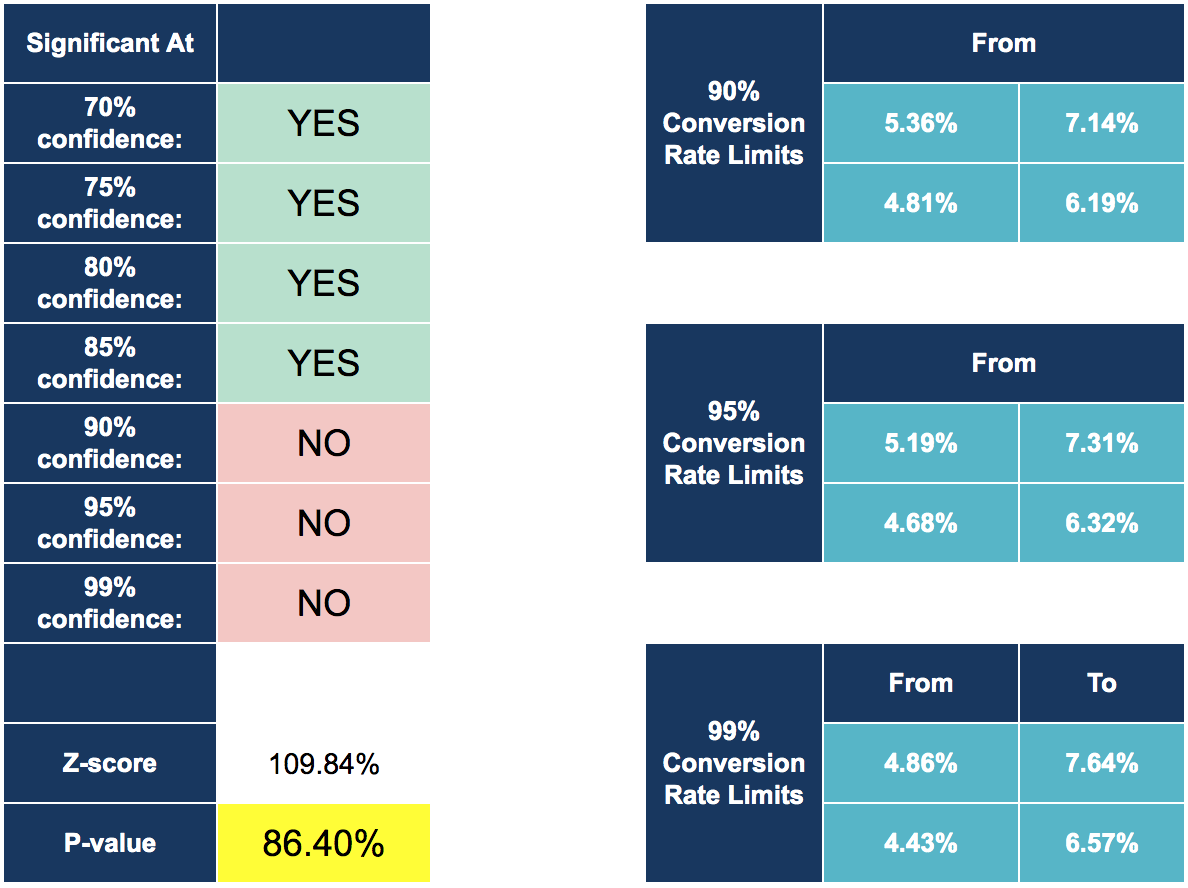
How confident should you be in your test results?
Statistical significance describes how likely a result is caused by something other than random chance. It’s how confident you are that the results are not random chance.
If you were to flip a coin, there’s a 1/16 chance that tails will show up all four times in a row. Yet, if you were to throw the coin a fifth time, there’s still only a 50/50 chance you’ll get tails again.
On consecutive throws, you must include the data of the previous throws to determine the chances of seeing heads or tails.
We need a minimum amount of data before we can calculate the confidence factors.
Eventually, the odds will catch up, and after 100 flips, you should end up with 47-53.
When you are picking your confidence factors for any ad test, you’re asking, “how confident am I that these results are meaningful and not chance?”
So how confident should you be in the results before you take action?
The more critical the decision, the higher you should set your confidence factor.
| Importance | Variable | Minimum Confidence |
| Less important | Long tail keywords | 90% |
| Important | Landing pages | 90% – 95% |
| Most important | Sales pages | 95% – 99% |
| Most important | Brand terms & best generic keywords | 95% – 99% |
Now the next time someone wants to discuss confidence factors, there are just a few rules to keep in mind for the conversation:
- Statistical Significance is how likely an event is caused by something other than chance (in this case, such as the ads being different from each other).
- If your sample size is too small, any result can be due to chance.
- In a large data set, there will be periods of anomalies, but the overall data will show you the true results.
- Never go below 90% confidence factors.
Regression to the Mean
With this phenomenon, results can be extreme on the first measurement but often much closer to the average on the second measurement. If you were ending a test because it’s reached statistical significance, you could be seeing a false positive. Your winning variation may regress to the mean over time.
A low significance level means that there is a big chance that your ‘winner’ is not a real winner, we want to reduce the risk that this happens.
In theory, you want to set your statistical significance as high as possible to reduce the risk and to be as confident as possible, but statistical significance is not a stopping rule as we have already discussed. For statistical significance to mean anything, two other, very important, conditions must be met:
- The sample size is big enough that the results are reliable. Hence, I recommend using a sample size calculator to ensure these requirements are met.
- The test has run for long enough so that the sample is representative of your audience.
Now, all that being said. Should you wait until a winner of the test can be declared with 95% certainty or greater. Why not decide at 70%.
As we discussed, It’s possible to end the test and make the wrong choice. However, In any A/B test that has been running for a reasonable time, it could be detrimental to not conclude the test as soon as possible and choose a winner.
There’s a cost to not making the most of an opportunity and a cost for getting it wrong.
The thing is, you could still make an incorrect choice if your results are 95% significance.
Stopping your A/B test early
It’s a good idea to check the test results on the same day of the week that you started so that each time you review the results they are comprised of a complete weekly cycle.
There is a cost to not acting on the information you have and instead opting to wait for greater certainty. Every day that the worst performing version is running you losing sales and wasting resources.
To avoid this, we try to calculate that opportunity cost and compare it to the potential gains of continued testing.
At this point, If our offer example from above, sales offer A and sales offer B had been running for two months there is an 8% probability that we would have seen these or more extreme results in B’s favor if B was inferior or equal to A.
If we continue the test and assume that the data continues in the same proportions, it would take roughly three weeks to get to statistical significance. Of course, if B’s advantage grows or shrinks, the time to significance could shorten or lengthen.
So what are we losing during that time?
If we stopped this test now, then we can assume we would gain a lift that would give us an average 1% higher conversion rate. Only 1% because half the visitors are already seeing sale offer B.
We would gain an average of 7 to 8 more sales over three weeks.
Although, there’s an 8% probability that A is the actual winner. That’s a 1 in 12 chance.
The scale of the potential loss is 8% and the widest likely gap between a leading A and a trailing B – is about 2%, while the scale of the potential gain 92% of the time – the widest likely gap between a leading B and trailing A – is about 6%.
What I’m showing you is that when you take into account the effect of these outcomes, the probabilistic value of choosing B increases.
It’s also worth noting that waiting for significance is not waiting for certainty. Three weeks later we would still have a 5% chance of making the wrong choice – there would still be a pink overlap area.
95% is just a convention and conventions are necessary.
We can say, 95% of the time, our sample results will fall within x% of the actual results in the total population. This convention makes it simple for us to describe what’s happening. As marketers, we can say, “these results are significant” or “these results are not significant.” This makes reports more straightforward to understand and summarise.
Bear in mind, most A/B testing tools will call statistical significance without waiting for a predetermined sample size or a predetermined point in time to be reached. That’s why you might notice your test flipping back and forth between statistically significant and insignificant. With that in mind, statistical significance does not therefore equal validity.
Letting tests run on longer
There are external factors that threaten the validity of your tests. For example:
- Black Friday Cyber Monday sales
- A positive or negative press mention
- A major paid campaign launch
- The day of the week
- The changing seasons
Let’s say, for example; you were to run a test in December. Major shopping holidays would mean an increase in traffic for your store during that month. You might find that in January, your December winner is no longer performing well. Why? Because of an external validity threat — the holidays. The data you based your test decision on was an anomaly.
You can’t eliminate external validity threats, but you can mitigate them.
- Run tests for full weeks (e.g., don’t start a test on a Monday and end it on a Friday)
- Include different types of traffic (e.g., don’t test paid traffic exclusively and then roll out the results to every traffic source
Evaluate
Conduct post-test analysis
Once the test is done, regardless of what you expected to happen, conduct a post-test analysis.
Don’t let your gut feeling overrule test results, or let your assumptions overrule insights. The winner in your A/B tests is often surprising. The goal is to test which has a better conversion rate, not design, be careful not to reject the results because of personal bias.
A/B Testing Statistics
Statistics are a big part of testing and optimization. We use statistics to guide our process because they help us make better decisions under uncertainty.
They reduce risk by clarifying the expected outcome of a given decision.
The tools you choose will make it easier to understand, but a base knowledge of what it all means will help you analyze and explain your test results later on.
Let me explain…
Mean
The average. Your goal is to find a mean that is representative of the whole. If you’re trying to work out the average price for email tools it would be mad, almost impossible to try find and add the price of every email tool on the market by the number of all email tools on the market.
Instead, we would isolate a small sample which is representative of the whole. If the sample is truly representative the mean price should represent the average of email tools across the world.
Revise
Implement, Iterate or Repeat
Depending on the outcome of your test you may choose to implement the winner, repeat the test or try additional variables.
And do you know what… If you’re in doubt, it’s perfectly reasonable to retest. Considering the impact A/B testing can have on your bottom line, it’s worth retesting.
In fact, do a lot of A/B tests. If you learn enough, your marginal gains from your positive results add up to a big boost in your sales. If your test reveals a lemon! That’s fine too. In fact, it’s really important.
Don’t overlook the losers
A classic mistake is to overlook the failures. Some experts make a point of publishing a Failures Report where they identify the biggest losers of the quarter and what they learn from them.
If you have properly crafted a hypothesis, even the losers can help you gain insights that you can use in the future.
Your focus should be to learn, not establish if something is successful or not.
Templates Used in This Post
Risk vs Reward tool
A/B test duration estimator
Audience size calculator
Structured analysis data sheet
Statistical power calculator
This post is part of a series to help marketers better understand their data. If you would like to see a change in the way you start A/B testing, it begins with a conversation. Reach out to me at mike@knowndigital.com.