The two common problems I see when assessing an advertisers marketing strategy are:
- They’re underutilizing their own organization’s data.
- Or, they do a bit of this, a bit of that, and they see what sticks.
Believe it or not – it’s as simple as following a step-by-step process.
Data-driven marketing
As a strategic optimization consultant, my goal is to increase the return on investment for businesses. I do that by using the organization’s data to invest our resources in a better experience for their customers.
I’m going to share with you how to implement a data-driven marketing strategy into your business, and what effect it can have on your multi-channel campaigns.
This step-by-step data-driven marketing strategy will help you:
- Identify your most significant opportunities through data analysis.
- Turn your assumptions into insights through testing.
- Visualize the predicted outcomes.
- Develop your iteration and optimization process.
Ultimately, following this process, you will be able to calculate the risks and costs involved in launching and expanding your marketing campaigns.
To help explain the process, I’m going to show you a case study so you can visualize a real data-driven marketing strategy.
Here’s the proof
Pangea Maps 10Xed their leads within twelve months. They went on, the following holiday season, to triple their revenue YoY and maintain a substantial 30% margin.
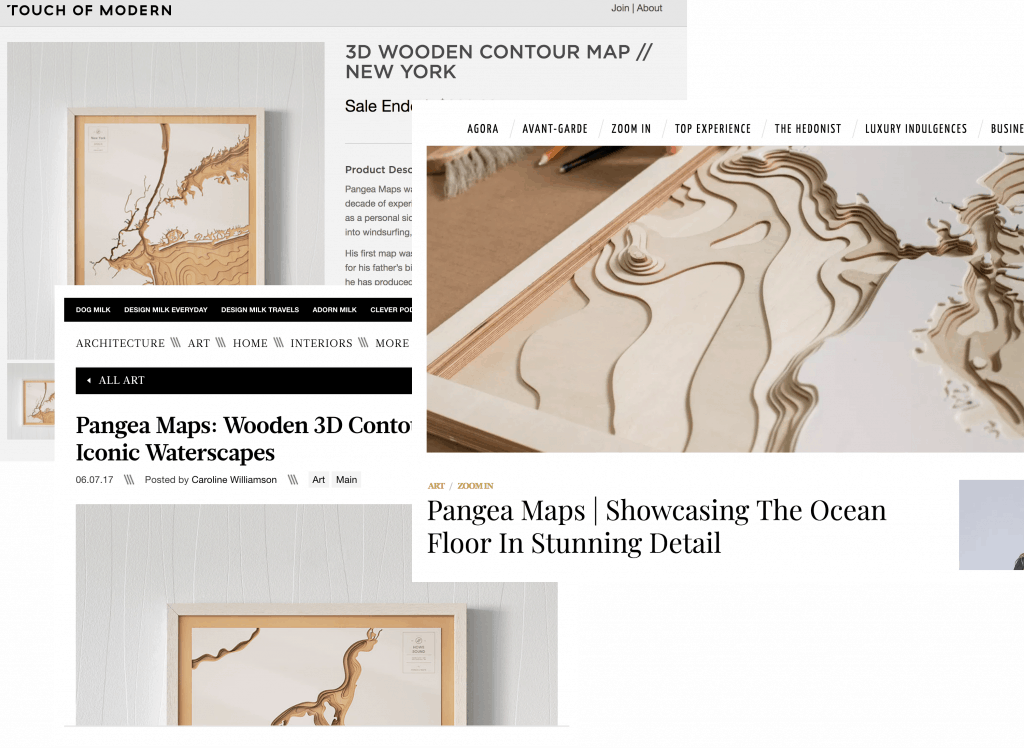
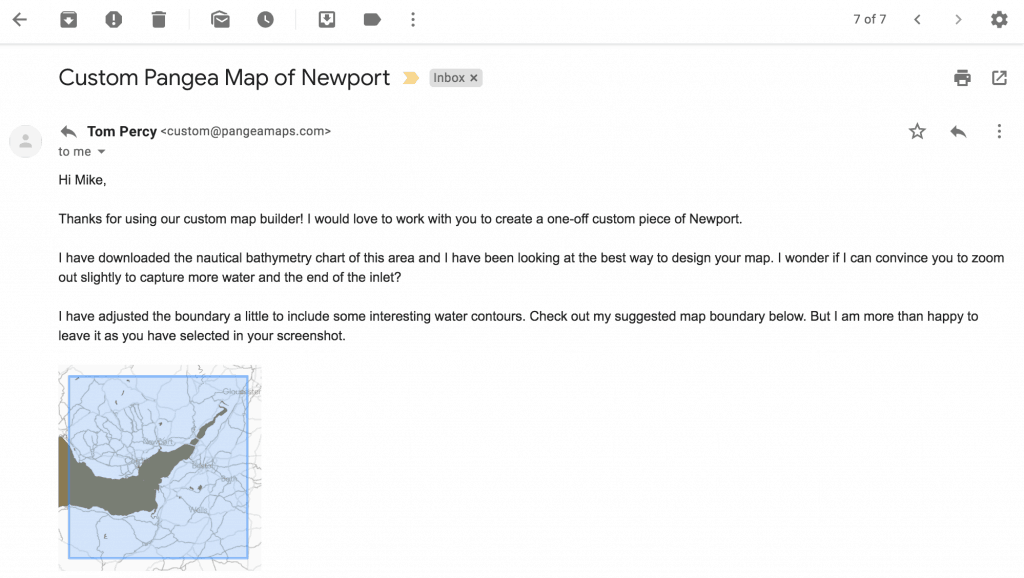
This is Tom, Founder, and CEO of Pangea Maps, he is an industrial designer and an accomplished entrepreneur. His company makes incredible 3D maps cut from birch plywood that detail coastlines and the contours of the ocean floor.

The first map he created was of his hometown, Moreton Bay, Australia. It was a present for his father’s birthday, and from that preliminary piece of art, Tom built a thriving business.

When it came to marketing his maps, he did a bit of Facebook marketing, some Google ads, there was a piece in the press, and it all kind of worked. The first campaigns were somewhat scattershot, but the business grew, and sales increased.
Tom was getting leads, but the leads were not cheap, he didn’t know what was landing customers, and he didn’t know what had caused his business growth to fluctuate.
He was shooting blindfolded. This made it impossible to scale.
He didn’t know where to invest in his marketing budget. He had no way of knowing what his audience wanted, and there was no clear way to make any of this better. Tom was at a point where his investments in digital marketing weren’t moving the needle.
However, Tom wanted to be in a position where he could turn on the taps when he wanted more sales. As a small business, he needed to keep tight control of his finances but still wanted to scale fast, without risk.
To grow his business, Tom needed to gain insight into his website and digital marketing performance – a journey that starts with a thorough analysis of his data.
How we put Tom on the map
Tom knew he should have been tracking his numbers and intelligently using his data to make a plan, but none of the blogs he read told him where he should start, let alone how to do so without risk.
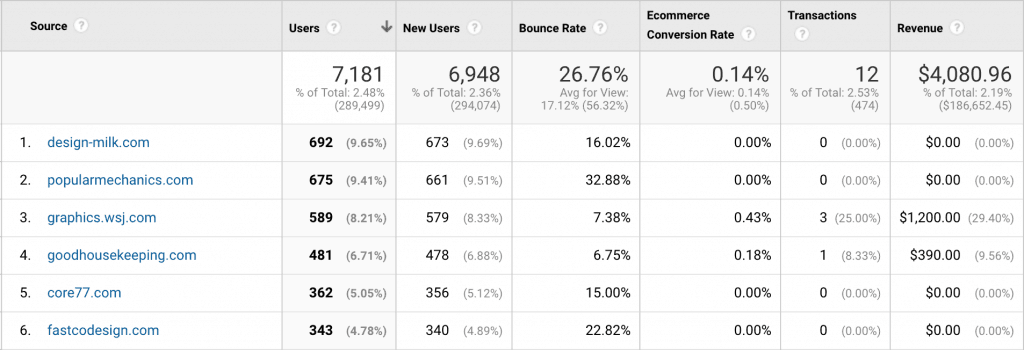
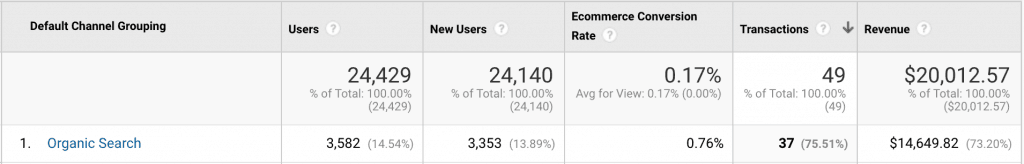
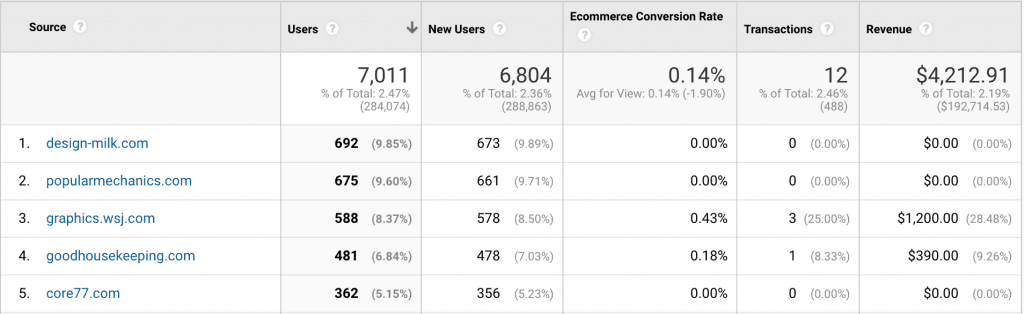
Tom thought about his business. He remembered that Pangea Maps had been featured on some big sites like the New York Times and Design Milk. Tom assumed that these writeups would be great for business and rightly so because he gained a ton of new visitors.
The problem with those visitors was that they browsed the maps, but they rarely bought.
Where else could Tom look? He knew the site was also getting organic traffic and those customers made purchases. So the obvious place to consider investing was search engine optimization. Right? But Tom didn’t know how much his search engine optimization efforts costs. Which meant he couldn’t work out how much to invest.
Tom could also see that he was getting lots of likes, comments, and shares on his social media channels. Frustratingly, without understanding the lifetime value of those social media followers, he couldn’t work out if they ever bought anything either! And, if they did, he couldn’t work out how much he could afford to spend on acquiring them.
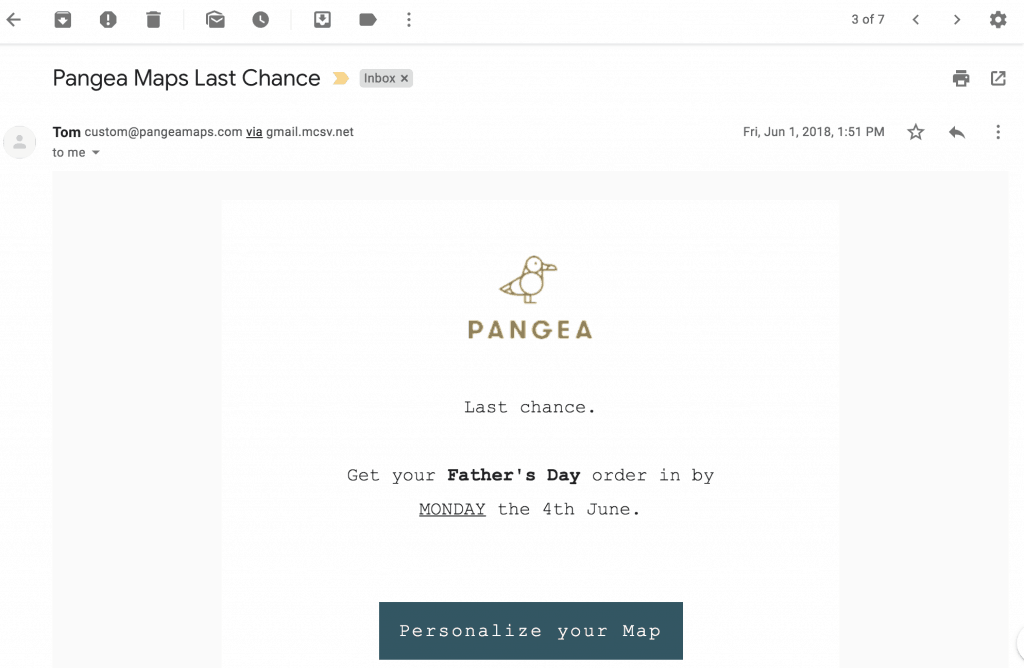
On top of all of this, his old email campaigns were bringing in a steady stream of repeat buyers, but it was expensive to acquire those first emails.
Even though the PR agency Tom was working with were very effective at getting top placements, and the site was getting a lot of hits, Tom had no idea how much value those site visits brought.
This is why I am telling you now:
“One of the most important steps in the process is understanding the financial cost and value of your marketing channels.”
To do that, you must first be clear about your objectives.
Set your marketing strategy objectives
So how do you understand the financial cost and value of your marketing channels? A great place to start is asking yourself, what are the long term business objectives? It doesn’t matter if you’re entirely new to business or a seasoned marketing director. What’s important is that you have clear goals in mind.
Here are some realistic goals that a data-driven marketing strategy can help you achieve :
- Double the monthly revenue YoY.
- Sell 8% more products.
- Increase profit by 30%.
- Acquire new customers for a $x—this was Tom’s primary goal.
- Showcase your products or services—this was Tom’s secondary goal.
- Build a community of followers and fans.
- Increase awareness of your brand.
- Showcase your company’s culture.
Importantly, by agreeing on a single goal – to acquire new customers – we knew what we were working towards. So, be clear about your desired outcome for the money and effort you are going to invest in your marketing strategy.
Based on Tom’s objectives, we benchmarked the supporting metrics. We did this by pulling the monthly invoice data into our dashboards which meant we could see week on week what impact our actions were having on the business and whether we were on track to meet our goal.
The supporting metrics that would help us work toward our final goal were:
- New unique visitors to the site.
- The cost of acquiring unique visitors to the site.
- The number of email leads.
- The cost of email leads.
- The conversion rate of new visitors to email leads.
- Average order value.
- The conversion rate of email leads to sales.
If you also are trying to acquire new visitors, this list will work for you; however, it’s important to note that everyone’s goals are different. Spend some time thinking about metrics that work for you.
Now we had the metrics we needed to segment the data and within it find which channels, demographics, and locations perform better than the others.
Find your numbers
Here is a quick overview of the numbers you can collect to help map out your data:
- Collect your back office numbers.
- How many calls, leads, or visitors do you currently get?
- How many calls, leads, or visitors turn into sales?
- How long does it take to turn them into sales?
- Review Google Analytics.
- How many visitors do you get?
- How many unique visitors do you get?
- How many goal completions do you get?
- Check any of the ad platforms you have already used for marketing.
- How much are your impressions, clicks, landing page views, and conversions costing?
- How many impressions, clicks, landing page views, and conversions are you getting?
You can download the template planning worksheets I use from here. I use the planning template for mapping out objectives and tying them to benchmarks.
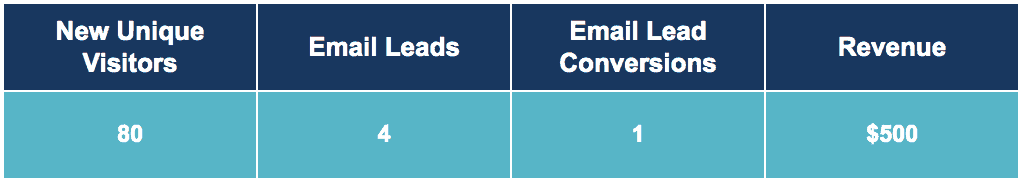
Looking at Tom’s data, we were able to work out that for every eighty new visitors to the site, four turned into a potential customer within thirty days.
Take stock of your marketing resources
The reason for collecting all of the numbers is so that we can factor our resources into our strategy.
Budget – we didn’t have bottomless coffers to spend on ad space and creative design.
Limited market size – there are only ever so many people in the market at any time.
Time – How many people did have we have to work on this campaign? They only have a certain number of hours in the day.
We only wanted to invest our resources in the places that would give us the most significant multiple on our investment, and we had to make sure we could achieve our goals with the resources we had.
By visualizing our data in charts we can start to predict which channels will give us our biggest bang for bucks.
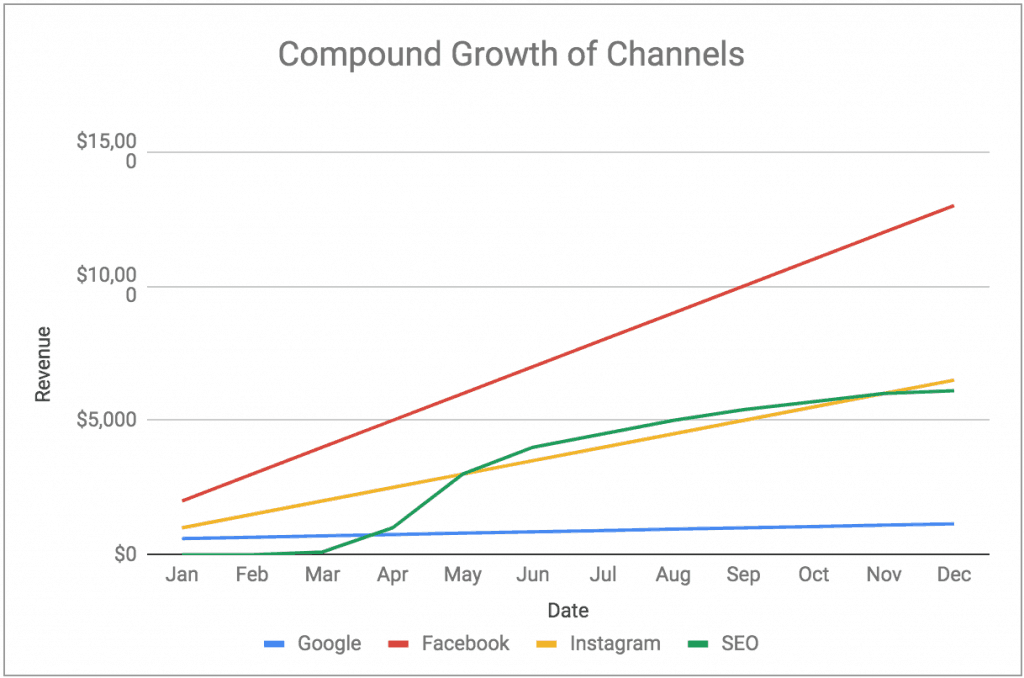
You can use this chart to predict the growth of your channels.
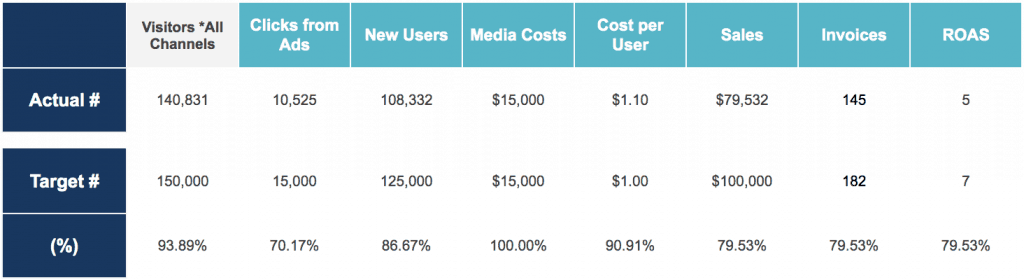
We populated a sheet with our target and actual benchmark numbers.
From an analytical and marketing point of view, this is a vital step. These numbers lay down the boundaries that we work within.
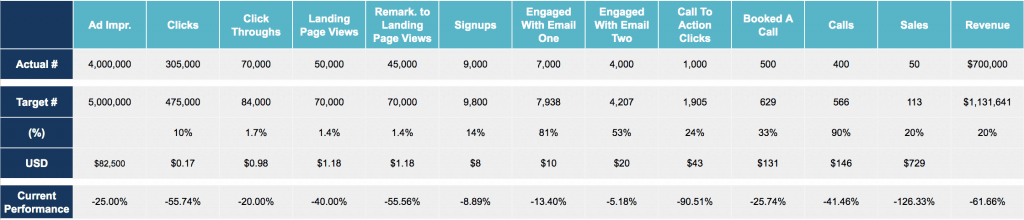
It also helps to include a row that shows how much you’re under/over performing.
Download the Benchmark Template Sheet.
Using a benchmark sheet, we could now derive some cost/benefit benchmarks:
- Our target was to acquire new visitors to the site for under $1.
- The cost per email lead should not exceed $15.
- The email-to-sale conversion rate must remain over 25%.
- The most we could afford to pay for a new customer was $60.
When running the campaigns, we had to keep these metrics within limits defined in our marketing strategy. Provided we can do that, we would always have a positive return and could move additional revenue back into the marketing campaigns that worked.
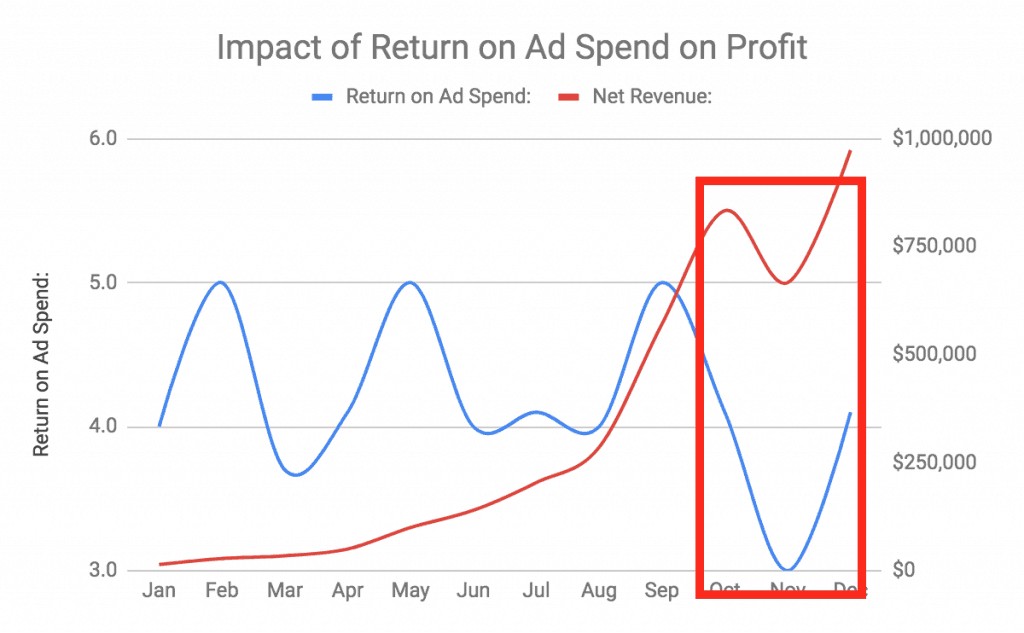
We used Return On Ad Spend Profits worksheet to manage our investment and ensure our cash flow was still positive.
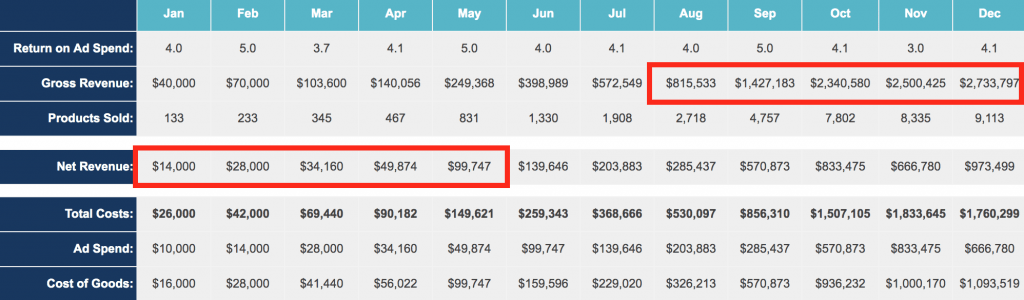
You can see in the chart below that if we drop our performance and miss our benchmarks, it impacts the money in our pocket. If this happens over and over, it compounds, and we will run out of money to spend on marketing. This is a problem because now we have to take on debt from elsewhere to fund our campaigns.
Try plugging your data into the Return On Ad Spend calculator. This will help you understand if your campaigns have a positive return and more importantly if they’re scalable.
From the ROAS Worksheet, we could derive if our campaigns were working and had a positive cash flow.
If we stayed within our agreed key performance indicators, for every dollar we spent, we made back a multiple of that in revenue. This is what makes a data-driven strategy risk-proof and allowed Tom to grow his business.
Roundup:
- Clearly define the objectives of your business and marketing. Focus on just one or two. The more you have, the harder it is to keep track and know if you are getting there.
- Based on your objectives, lay out your performance indicators. Be thoughtful about what those are, what works for someone else might not work for you.
- Benchmark your current performance against those indicators. Use a ROAS worksheet to figure out where you are and manage future investments.
What, who, where & when
Interestingly, Tom’s maps aren’t new or the cheapest on the market, yet, his sales increased. I believe this is because Tom understood the benefits of his maps, the unique selling points.
- Pangea Maps fulfill a critical reason why people buy, which is, they tell a story.
- Tom’s customers were buying a hand crafted piece of art from the artist, they get to speak to him personally.
- The maps were often gifts, and the design process was part of the experience.
Behind these beautifully detailed maps, there’s always a customer story. Because of the story, people wanted to share the maps with others. Which was great news for Tom as it made it easy to create eye-catching content to promote them?

Find the ultimate benefit
What is the ultimate benefit of what you’re selling?
- Opportunity?
- Reduced risk?
- A better lifestyle?
- More time?
For example, an accountant sells piece of mind, and a financial planner sells a secure future. A SaaS product gives a user time, and a plastic surgeon sells confidence.
Is there a unique selling point that separates your product from everyone else?
- Free delivery and returns?
- Unlimited support?
- Free installation?
- Customer service?
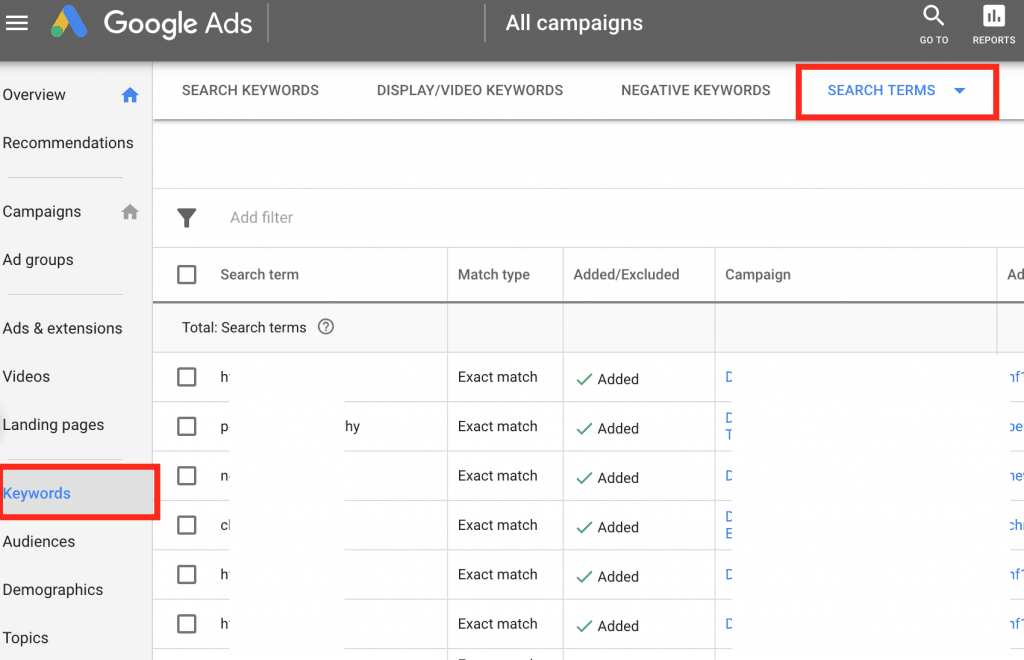
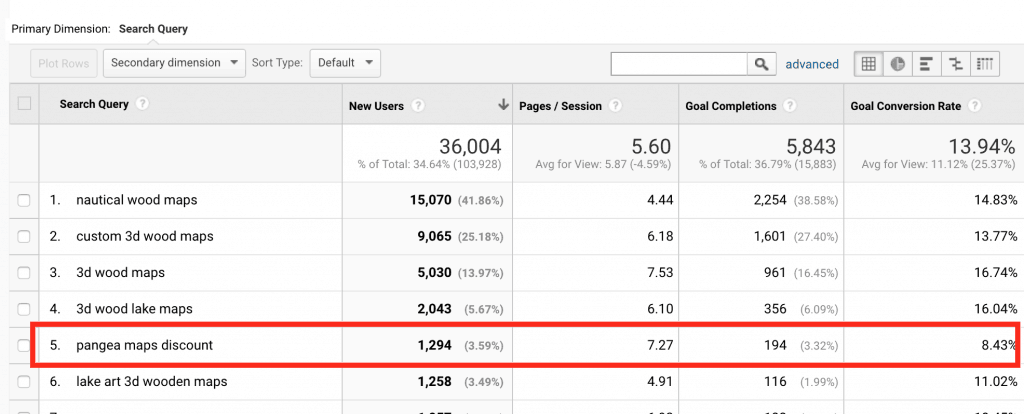
Search query research is an excellent source of inspiration. It will help you find what problems customers are looking to solve and what influences their decisions to purchase.
Looking at the search query data, we could see that many of the sales were coming from people looking for last minute delivery and five-year anniversary gifts.
The fifth year is the year you give a wooden gift. We were selling people a treasured memory.
If you have access to Google Search Console, then you can start your research there.
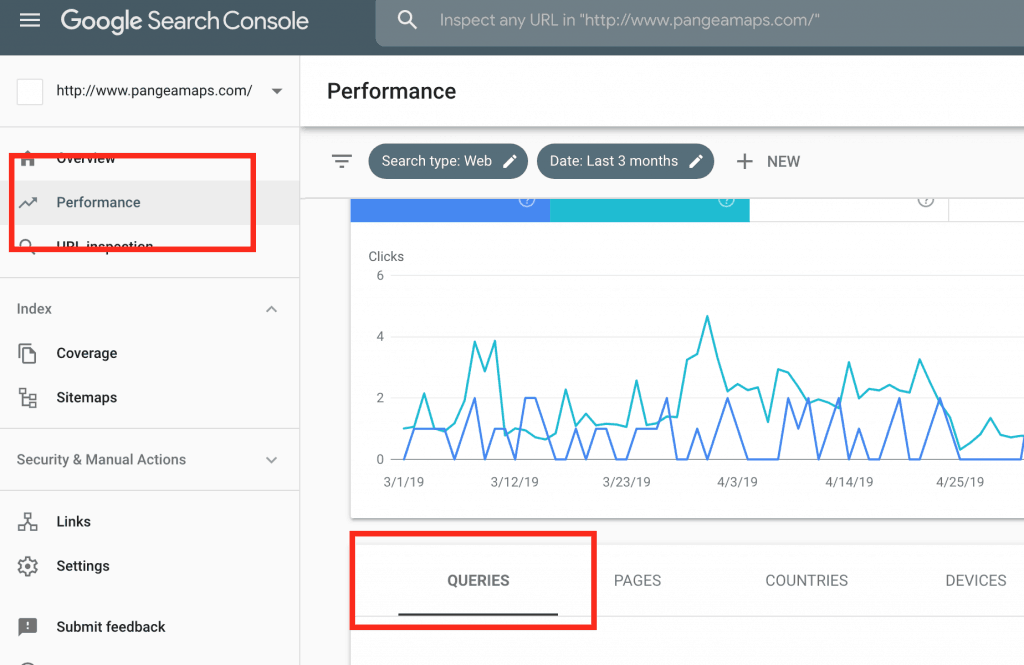
Alternatively, if you have used Google or Microsoft Ads, you will be able to use the search query reports.
An analytics tool like Ahrefs or SEMrush will also help you understand the type of queries people are using to find your products and services.
Ask yourself:
- What’s unique about your offer, and why would someone choose to spend money on it?
- What type of message would remind a user they have a problem.
- What would motivate a user to search for a solution?
- What are the risks if they don’t take action.
What’s unique about your offer, and why would someone choose to spend money on it?
If you’re feeling a bit stuck, I have written a post on finding your target market. Using the methods described in this post, you’ll learn how to uncover what your customers value most about your business.
Create customer personas
To help understand who Tom’s customers were, we invented many personas. We created these identities for each type of customer we wanted to target.
Creating personas allowed us to craft testable themes for our ad copy and creative. By trying to understand their day-to-day lives, we can speak to them using their language and empathize with their challenges.
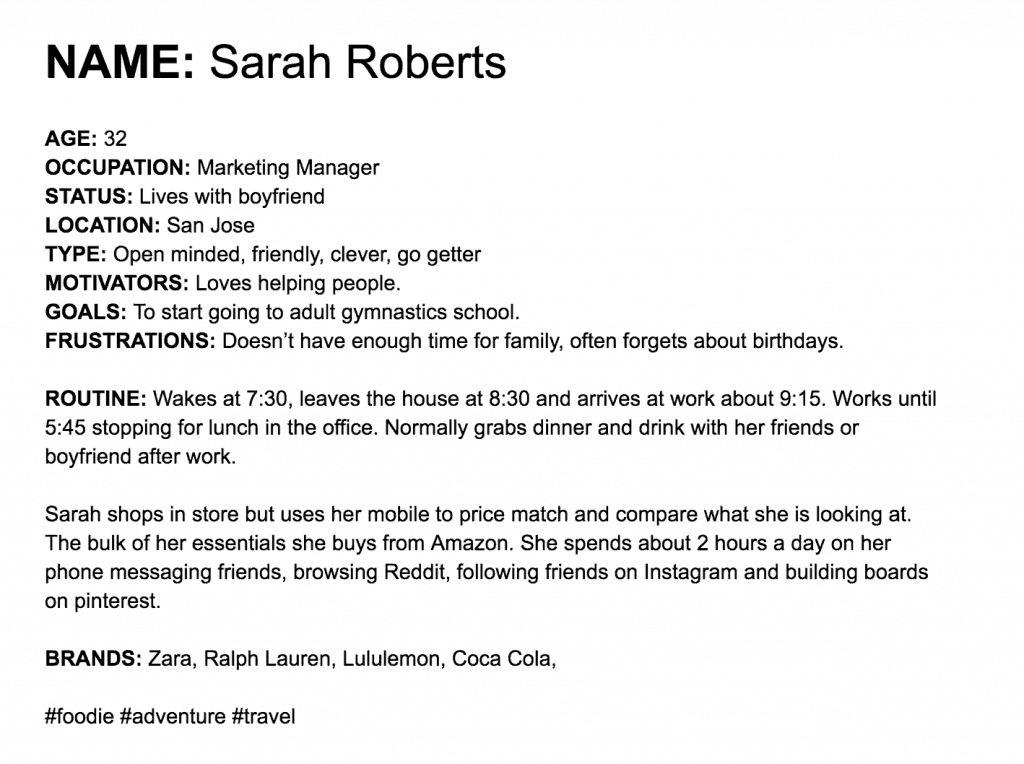
If you need some help getting started, use this Customer Persona Template to build your own personas and customer avatars.
This is an example of a persona we created. It doesn’t have to be complicated! But personas are important for data-led strategies for two reasons.
- We can use them to segment audiences and measure the cost against the value of the audiences we target.
- We can use them to help us craft testable messaging themes that we use to speak to our audience.
If you’re feeling a bit stuck, I have written a post on finding your target market and a step-by-step process for testing ad copy. Using the methods described in this post, you’ll learn how to uncover what your customers value most about your business.
Invest in the right platform
Where you put your money makes a big difference, and our decision to invest in Instagram wasn’t a lucky guess. Like I said before Tom had invested in many channels in the past, and he had his assumptions about his customers and their desires.
We went through a step-by-step process to establish the facts, and that started with our analytics data.
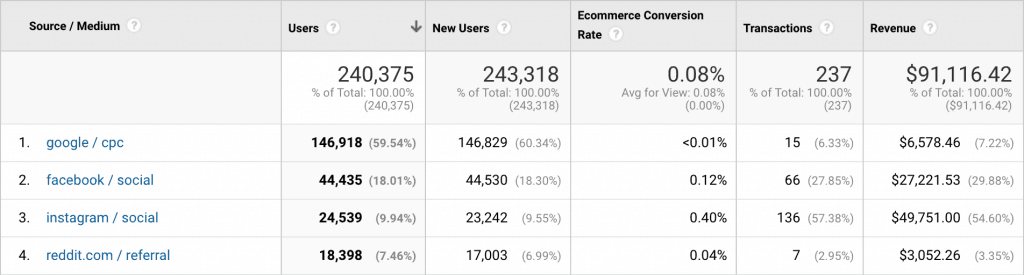
- What are your biggest drivers of traffic?
- How much does each of your traffic sources cost to drive new users?
- What have the highest conversions and conversion rates?
- Which sources of traffic start user journeys and which close them.
Depending on your customer, you may choose to focus on one advertising platform over another. LinkedIn, for example, allows us to target users in a very different way to Youtube or Snapchat.
Do your customer indicator research
Defining your customer indicators will help you know when is a good time to show ads to your customers.
It was tough for Tom to identify his customer indicators because people don’t leave a trail that makes it easy to predict who is going to be looking for a product like this.
It’s unlikely that anyone who became Tom’s customer due to our Instagram ads opened their app that day knowing that what they wanted to buy was a topographical ocean map. However, an ideal situation for us was if If they were already interested in a particular place, water sport or hobby.
You can find this information in lots of places, like Google Analytics.
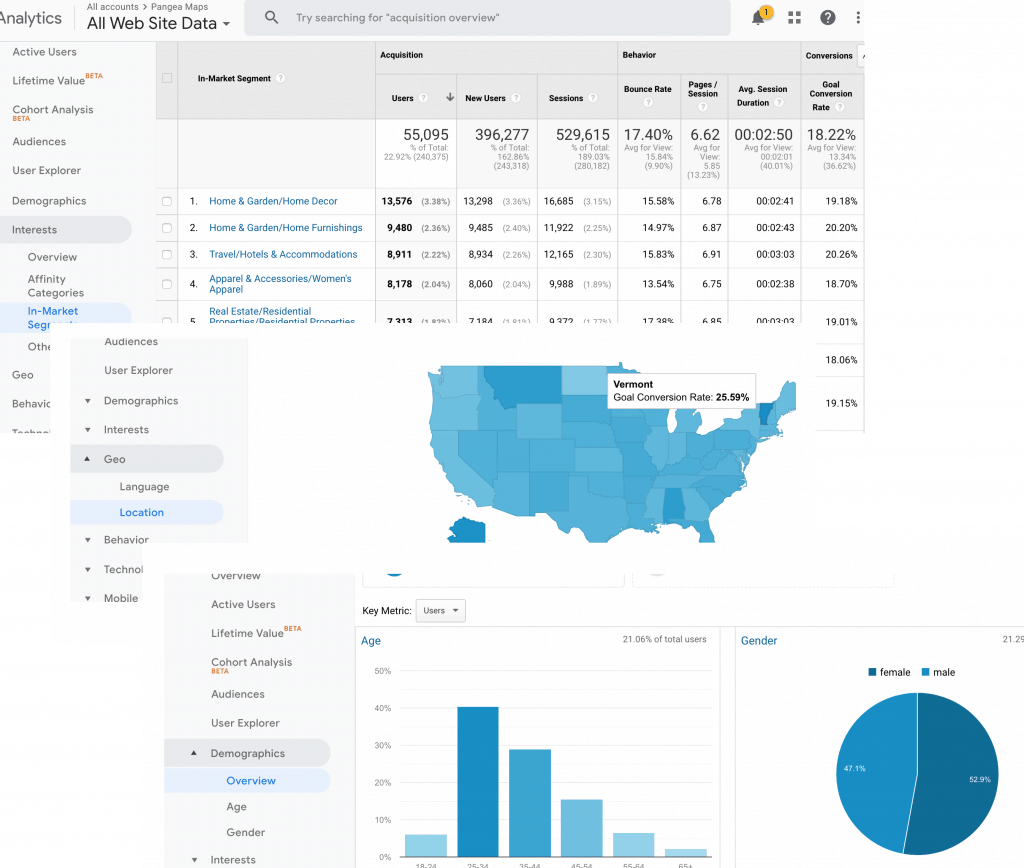
And Facebook’s Analytics tool is also packed with data and insight that can help you better understand and segment your audience before spending a penny.
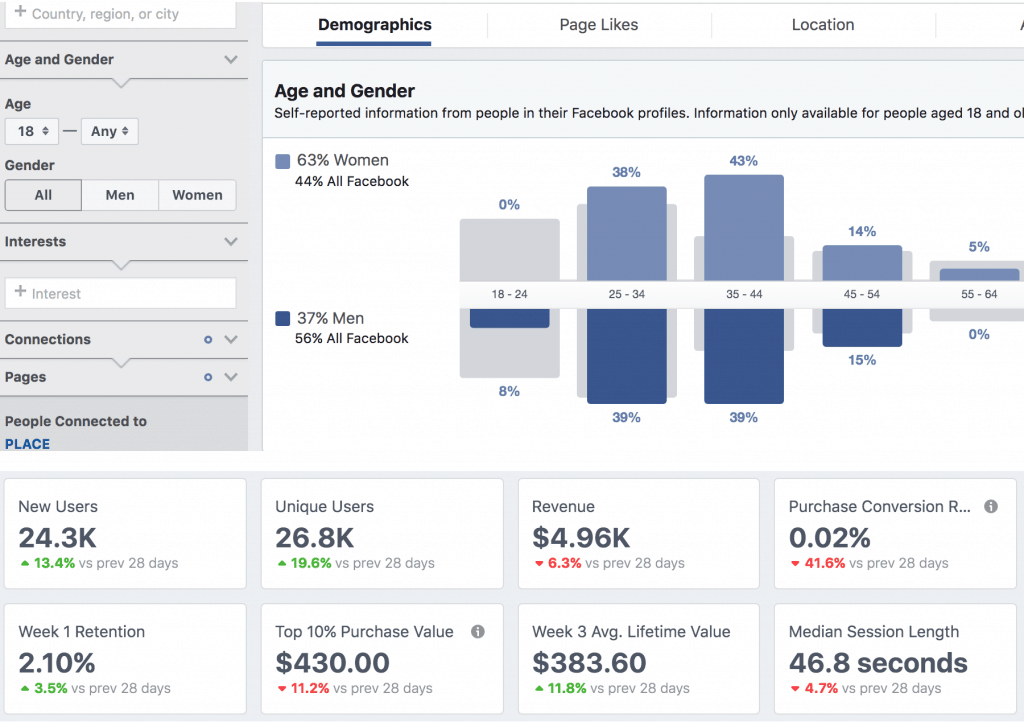
Through data research, we were able to identify the audience segments that were more likely to buy or were ready to buy. We used this and put an Instagram ad showing Tom’s product right in front of their eyes.
What are your customer indicators? They could be based on customer demographics like age and gender. For example, before or even after a certain age, there are some things that men or women won’t be in-market for. Therefore an advertiser could identify their customers because they fit within a very specific demographic.
Alternatively, your indicators could be:
- Keywords your customers use.
- Content they watch or read.
- Apps or tools they use.
It could even be the types of content they start to react to on social media.
If you’re looking for a way to learn more about your audience through your ads, read my step-by-step process for testing ad copy.
Tom started by listing the things that would highlight to him someone would be in the market and potentially ready to buy.
Our list comprised of about 15 key indicators.
Ready to buy
Customers that purchased would first use a search engine to research before they bought, and would then look for deals before paying.
Customers looking for a promo or discount were significantly less likely to convert.
Right at the bottom of the sales funnel, we identified the sticky pages and events where a customer would drop out and leave or purchase with just a little push.
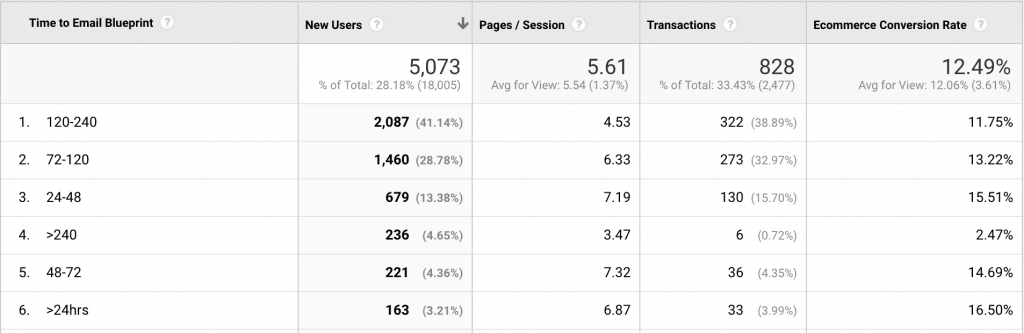
If a customer got their map blueprint within 48hrs, the likely hood that they would buy was higher.
In-market customers
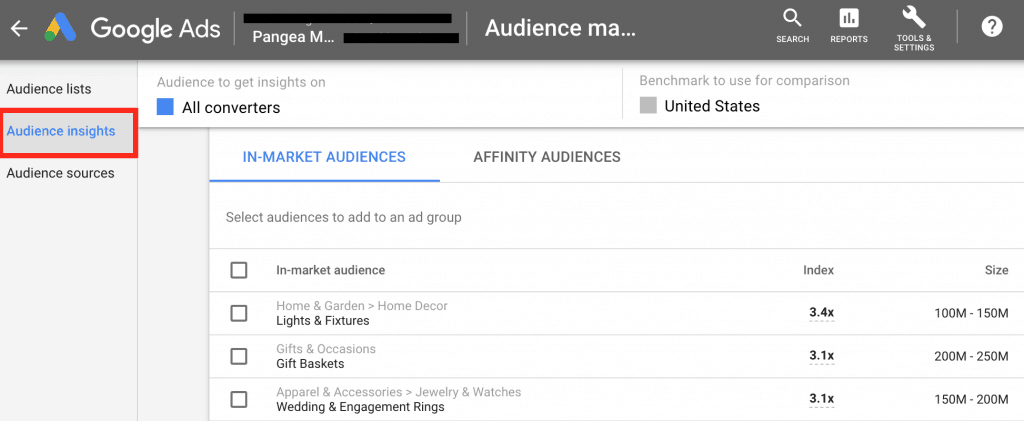
We could identify customers that purchased using Googles “In-market audiences” and target those getting ready to buy.
On marketplaces likes Amazon or Etsy, we also found customers using search queries like “wooden maps,” “coastline maps of [location]” and “five-year anniversary gifts.”
Browsing for inspiration
Using Instagram, Twitter and Pinterest analytics we spotted audience segments looking for unique birthday gifts and inspiration for engagement gifts.
If you can spot your customers have specific interests, you can segment them and work out the value of those customers to your business.
Future customers
It becomes much harder to find your audience when you’re trying to identify who’s at the top of the funnel. All these platforms are great at identifying “groups” of people that are interested in particular things. However, they are not so good at identifying people that may be interested in something in the future, but it’s an integral part of the sales funnel.
As it’s much harder to force a brand change once someone has become brand loyal, you’ll want to invest time to ensure you’re the brand they have in mind from the beginning.
Google has some cool tools to help you do this, like Life event targeting. You can also get smart with it yourself by building your audience using Facebook and LinkedIn to build Lookalike audiences.
If you’re feeling a bit stuck, I have written a post on finding your target market. Using the methods described in this post, you’ll learn how to uncover what your customers value most about your business.
Using old data to find new opportunities
Another way to find out who your future customers might be is to analyze Google Analytics to look for new opportunities in the old data.
We used our analytics tools to set up keyword ranking reports and hypothesis the impact an SEO campaign could have. Using the benchmark performance indicators, we reviewed the performance of the old Google Ads and Facebook campaigns.
As we dug deeper into the old campaign performance, we started to form questions, assumptions, and uncover exciting new ideas and opportunities.
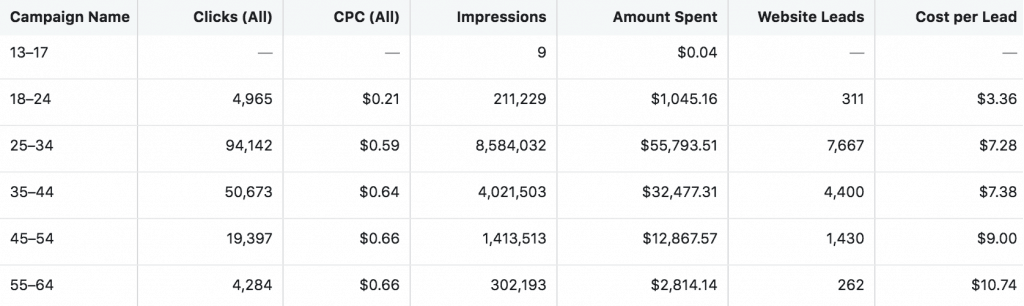
Tom had been using all the features on the Facebook ad platform. He had zeroed in on surfers, kayakers, and water-sports enthusiasts, and what we discovered was that this was expensive. We found that as he layered targeting, he increased the costs.
These findings helped us form assumptions which later became our first tests.
Roundup:
- Be clear about the real benefit of your product or service to your customers. Why should they buy it? what will it do for them?
- Create customer personas. Create as many as you need but be clear about who they are and how they would expect you to talk to them.
- Do your research. What channels work best for you, what targeting should you be using, how do you identify your customers?
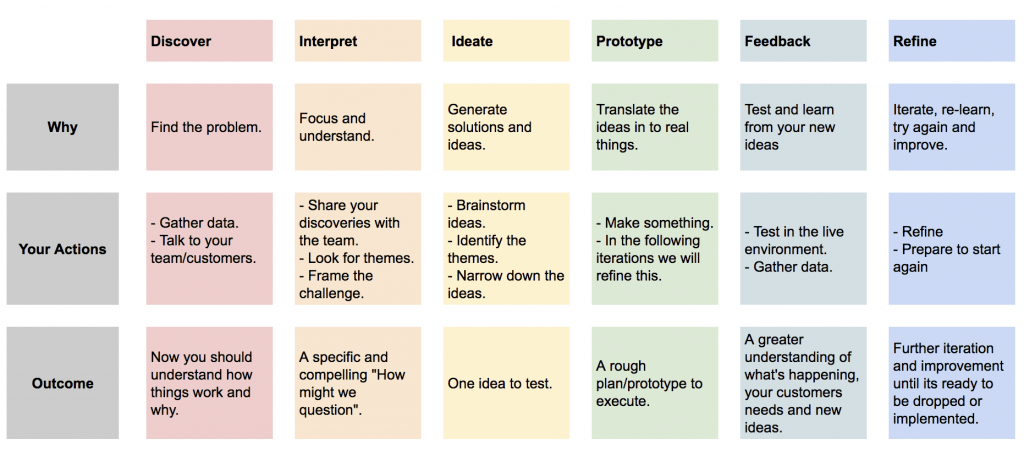
Ideation & testing
We had raked through all our data and found lots of fresh marketing ideas we wanted to try as quickly as possible. But it’s risky. What if we invest our money in the wrong place and it goes wrong? We need to test them.
Before testing anything, I recommend reading my step-by-step guide to A/B Testing. This guide is packed with tips and templates you can use to start your tests. More importantly, it will help you evaluate if you’re ready to begin testing.
As we researched more, learned lessons, discovered and communicated with customers, we made a list of the marketing ideas we wanted to try.
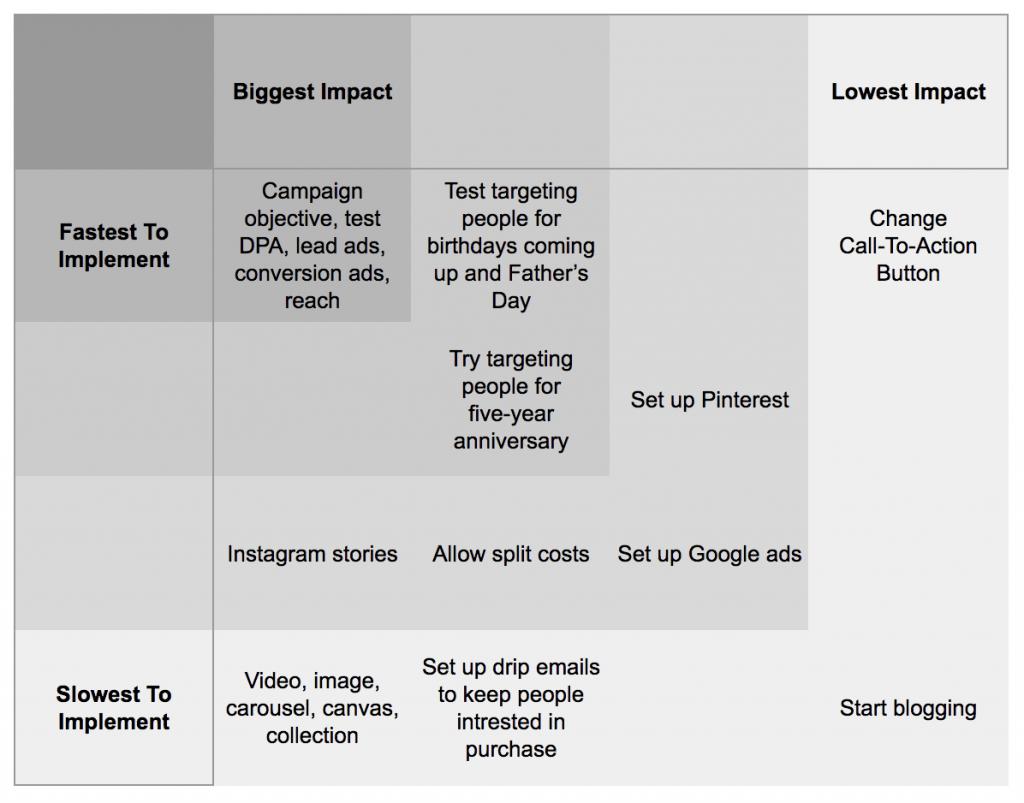
We ranked the ideas by speed to implement against the potential impact they could have.
We needed a step-by-step process for ideation, implementation, measurement, and reporting.
Only through such a structured approach could we be confident in the decisions we were making.
Click to download the ideation and outcomes template.
Before you can declare a test a winner (or looser), there are few things you need to define first.
- How big should your sample size be?
- At what point can you end the test.
- How to evaluate the results.
All these questions are answered in my step-by-step guide to A/B Testing.
Test the marketing channels
During our research, we hypothesized Instagram, and Facebook would be a great source of traffic. To prove it, we tested them alongside many other channels that we had also benchmarked.
We found that customers from Social media campaigns on Instagram and Facebook had a similar cost/value to Google Search Campaigns. But traffic from the social media campaigns had a much higher lifetime value.
It meant that we scale much faster.
Test the targeting
We tested Facebook and Instagram as Tom has done before, but instead, this time, using layers of interest targeting to narrow our audience.
We tried to find Toms audience by segmenting them into audience groups based on the personas we designed, and the audience research we carried out.
The idea was to direct specially tailored messages to them.
Here, you can see we broke out our audience segments by:
[Funnel Position]-[CampaignType]-[Location]-[Audience Interests]
The idea was to niche down our audience. Different segments would be delivered a very different message, but it didn’t work.
The highly specified audience was so small that the cost per impression inspired all sorts of water-sports wipeout metaphors.
The Facebook Ad platform was throttling the delivery of the ads. We hypothesized that this was because of underperforming ads, wrong audience targeting, and dropping audience sentiment.
From this, we learned that as we added multiple targeting layers, we increased the cost of the landing page views and limited our reach. Through many iterations, we established that the people that bought Pangea maps were not just limited to water-themed interest groups.
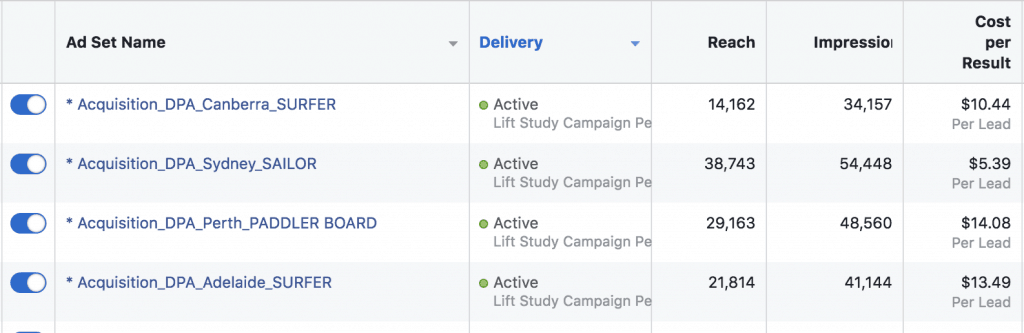
We found the most effective method was to target specific geographic areas with local maps.
Test geographic targeting
We tested advertising maps to users that were local to the area they were being targeted in.
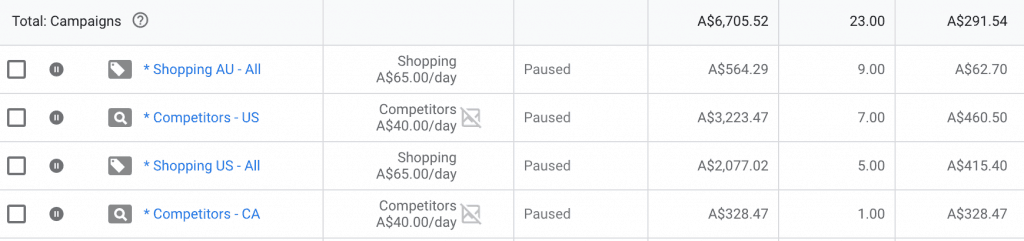
The ads were being optimized for email leads, and if a specific geographic location became too expensive, we would pause that ad.
Test the ad formats
If you’re looking for an easy step-by-step guide for designing and testing ads start here.
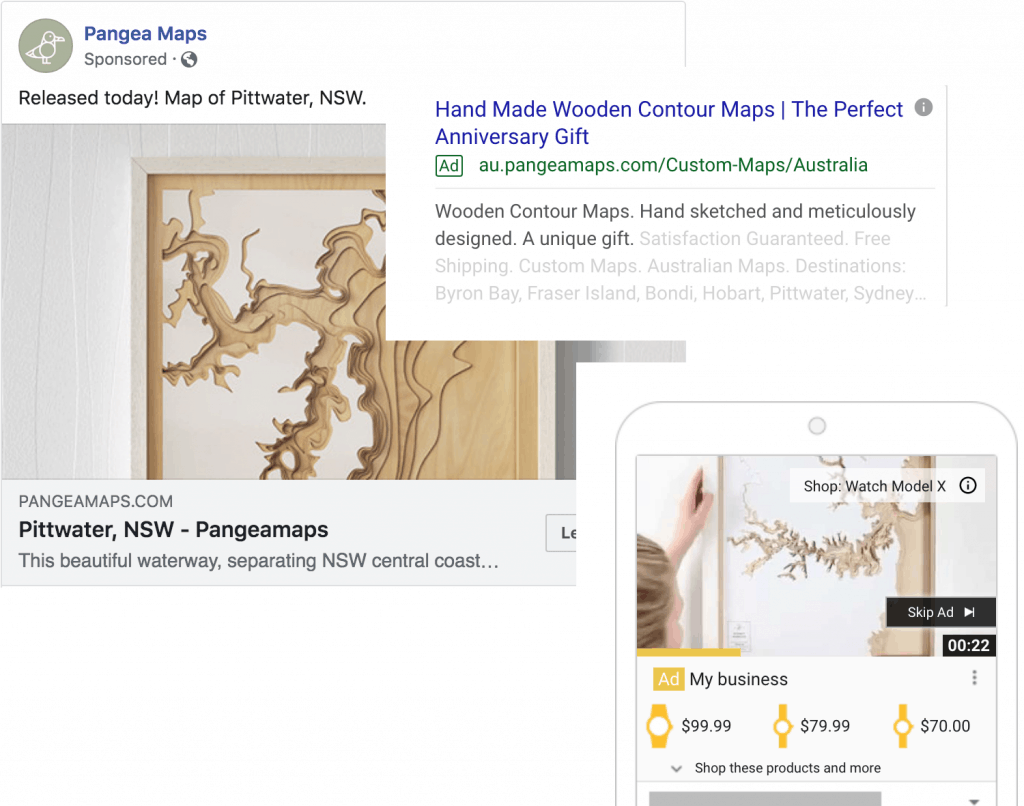
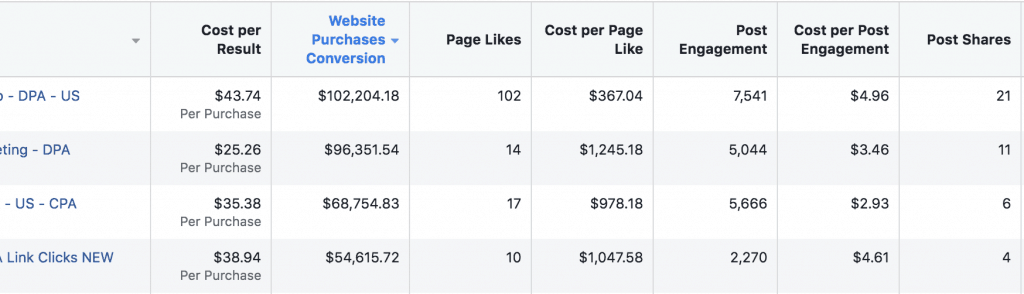
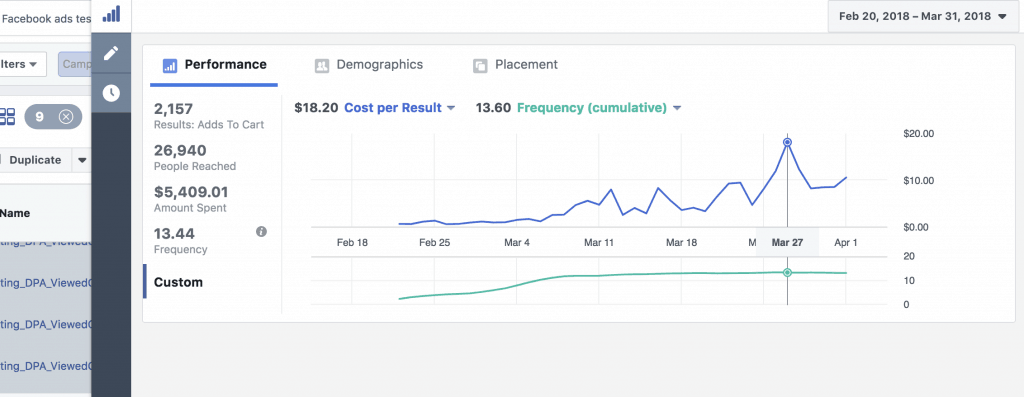
We bought what we already knew. Dynamic Product Ads (DPAs) were initially used for retargeting people who viewed a product on your site. They’re cheap and useful for e-commerce products, but instead of optimizing for sales, we optimized for leads.
The images, price, title, and description, are all pulled from a shopping feed.
This was good for targeting customers near the bottom of the sales funnel but still not perfect as this audience is too small, and we were looking for new customers, not repeat visitors. It was about this time Facebook introduced broad targeting for DPAs. This was our golden ticket as it would reach people who expressed an interest in particular products or at least similar ones, even if they hadn’t visited the website.
The broad target feature allows the advertiser to define a broader audience, then the Facebook ad platform automatically optimizes Instagram campaigns toward the objective.
Instead of adding interest targeting and custom audiences (which pushed up the cost) we left it to Facebook to decide.
We learned that it was tough for us to identify someone that would potentially be in the market for a piece of wall art like this as there were no clear customer indicators. But by allowing Facebook’s algorithm to do the optimization, our targeting was far more effective.
Track the tests
It was vital while we quickly tested different channels that we had accurate campaign tracking.
We installed all the platform pixels for gathering data, building audiences, and tracking conversions. We also set up web analytics tools for measuring what was happening on the site. Finally, we set up reporting tools like Supermetrics so that we could pull out the data into our dashboards and reporting tools.ls.
Review your results
Early in the marketing tests, we saw that the Instagram engagement rate and the ROAS was much higher than any other social media platform.
We narrowed our attention to a few promising marketing channels and then repeated the testing phase over and over to discover what worked best while maintaining our focus on one consistent idea.
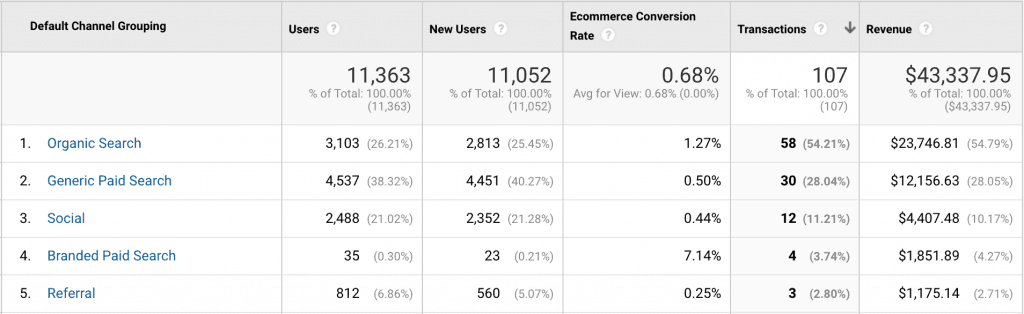
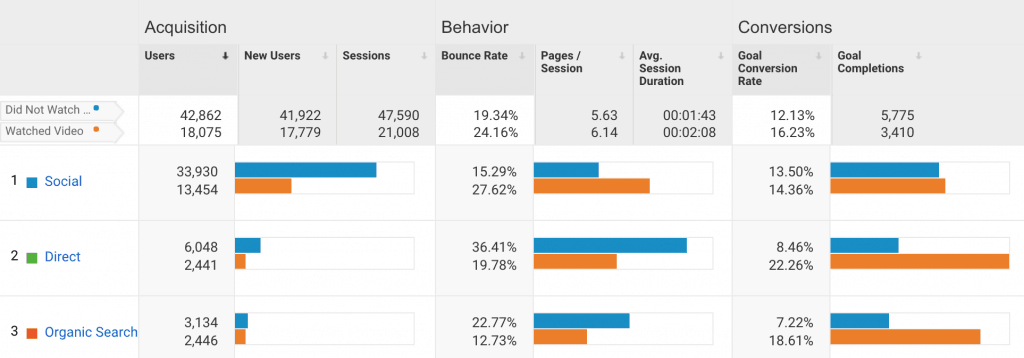
As previously mentioned, this research phase spanned a range of channels, including Google Product Listing Ads, Search Ads, Facebook Ads, and YouTube. Our findings also pointed to Instagram as the most effective platform, so we decided to focus our resources there first.
The comparison chart in Google Analytics was one of our go-to reports. We could easily compare the performance of a metric against a dimension weighted by the volume of that dimension. In this instance, it showed me that social media, and Instagram, in particular, was performing significantly better than the site average.
Instagram proved to be cheap and easy to manage—the low-hanging fruit.
Roundup:
- Test your assumptions. Ensure you have a structured and repeatable approach.
- Measure the results. Don’t get hung up on gut feelings, follow the numbers.
- Implement your changes. But make sure you spend some time reviewing the things that didn’t work. You’ll learn a lot.
The buying cycle
Once we had the data we needed, we started mapping out our marketing strategy and creating the ads. By this point it should be pretty clear to you which channels you should be using to engage your customers and at what point. Or at the very least, where to start.
Next, you have to work out what you want to say at what point in the buying cycle.
Getting the language correct now, can mean the difference between success and failure. I recommend reading my step-by-step guide for testing ad copy. Using the methods described in this post, you’ll learn how to uncover what your customers value most about your business.
It’s no use trying to sell someone car insurance if they’re still deciding what car to buy. You need to know when to put an ad in front of some one and what to say.
I recommend mapping out your user journey with a tool like funnelytics. It will help you visualize the steps your customers are going to go through.
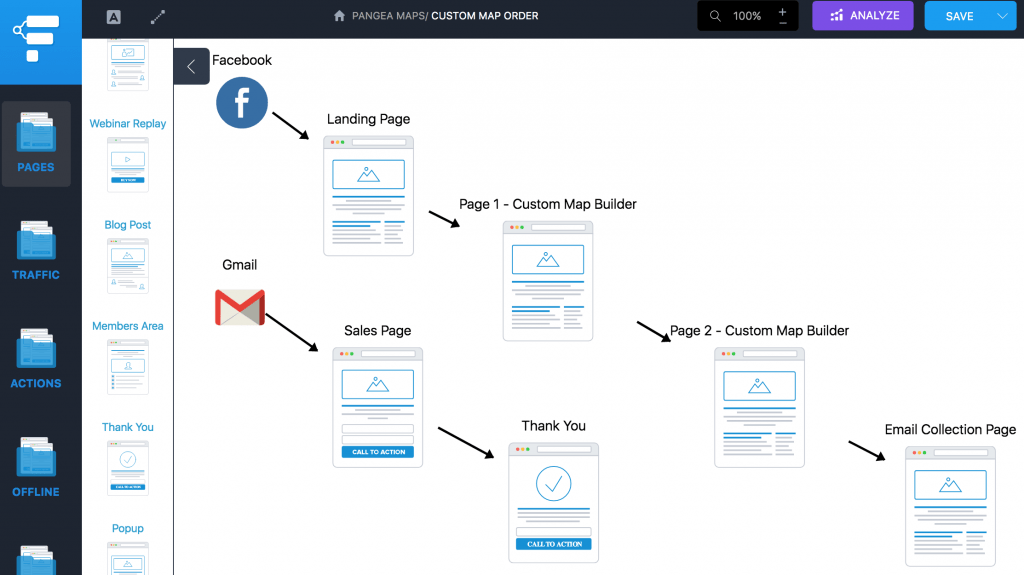
As we’re tracking the effectiveness of the ad campaigns at each stage of the funnel, and we know our target KPI’s, we can work toward our goals and optimize effectively at each stage.
We could also build audiences of people similar to our current customers and exclude the ones that weren’t buying.
Awareness
This is the top of the funnel – the part where potential customers become aware of your business and how your product may solve a pain point or improve their lives.
Consider that your potential new customer may not be aware they even have a problem that needs solving at this point. Therefore, the goal of this stage is to highlight the issue, introduce the brand and build trust.
Decision
Once our ads got eyes on Tom’s products, his engaging customer experience took it from there. The Pangea Custom Maps builder allows a customer to build and personalize a map for a loved one, giving them a one-of-a-kind experience. It’s not an off-the-shelf purchase, and the customer gets to be involved in the process.
Action
Right at the bottom of the sales funnel is the action or conversion stage. Once a consumer is ready to purchase, they need a final push to take the last action — sending over their money.
Once our customers had chosen a location to be depicted on their map, (which was one of our customer indicators), we were able to build campaigns that targeted only them. As would you know it but these people were the cheapest and easiest sell to. Tom personally emailed them a quote and a blueprint for their unique creation. He even offers a one-on-one conversation with them to be sure they’re satisfied.
Roundup:
- Awareness. How will you inform new customers about your product or service?
- Decision. Customers know your brand now, and they might have a good idea of what you do. Time to build trust.
- Action. What do you need to do to motivate a user to buy?
Data-driven marketing conclusion
Your marketing strategy is an evolving process, and certainly not a one-time sprint to the finish. Creating a data-led marketing strategy takes time and planning, but can result in huge wins. The advertisers that start investing in a data-led plan today are setting themselves up for long term wins tomorrow.
In this case-study, our data-driven approach led us to Instagram as a core component, but to rely on a single channel would be a pretty poor marketing strategy. What I hope your key takeaway from this blog is how to map out a plan, and how to gather the data to find the answers you need.
Objectives and goals. Get these straight from the start. Goal setting is the only way you are going to be able to track your time, efforts, and overall success.
What, who, where, and when. Use your data to answer the foundational questions to your campaign.
Ideation & testing. The words if you assume it makes an ass out of you and me come to mind. Never make assumptions; instead, by testing, you can turn theory into fact.
The buying cycle. Learn and understand these stages. Become one with your customers’ psyche, and you will be rewarded in turn!
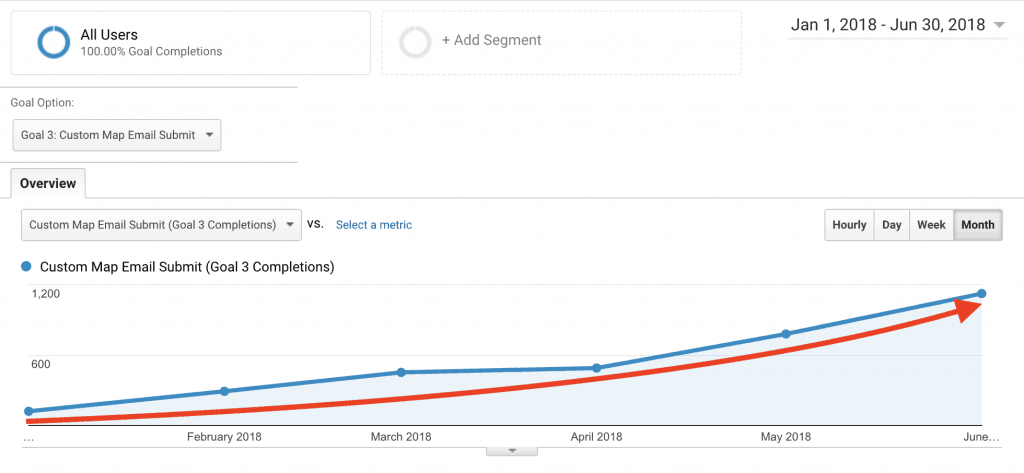
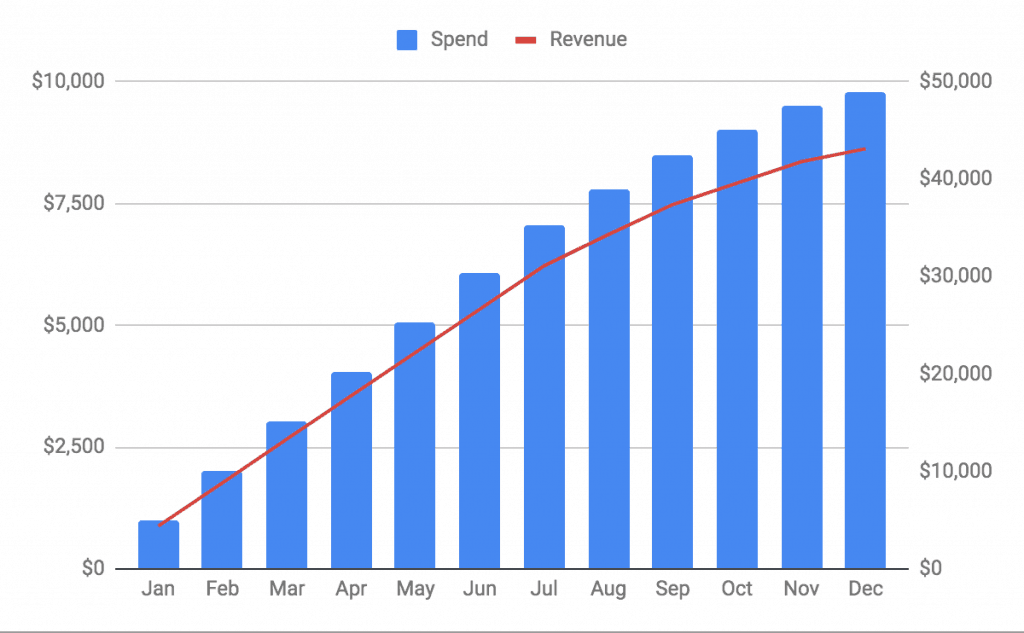
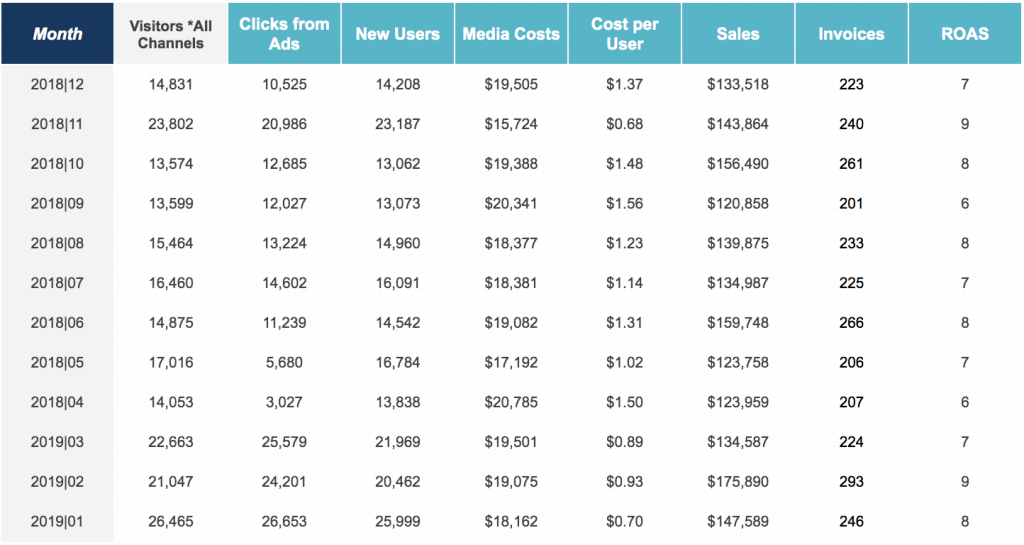
You can see below the impact that the new strategy had on Tom’s leads. Before December, things were ticking along.
When we implemented our new Instagram marketing strategy in January 2018, we saw increased leads every month.
Adopting a data-led marketing strategy will help you:
- Identify the characteristics that make up your best customers.
Personalize the messages that speak to your customer’s specific needs.
Score your leads based on the likelihood that the person is going to buy your product or service.
Nurture and develop relationships with customers.
Following a data-led strategy will provide advertisers with a solid foundation from which they can build a robust marketing strategy.
Templates Used in This Post
Planning worksheets
Predict the growth of your channels
Benchmark template sheet
Return on ad spend calculator
Customer persona template
Ideation and outcomes template
This post is part of a series to help marketers better understand their data. If you would like to see changes in your targeting and testing process, it begins with a conversation. Reach out to me at mike@knowndigital.com.